|
With the advent of global trade, it has become much easier to acquire gems from all over the world through both legal and illicit means. Because of this, it has become very important to be able to identify and grade gemstones. This can be done in several ways. One method is by color analysis of the stone. To date, this has been done solely by eye. This method lacks reproducibility and accuracy and will only give a gross description of the color. Attempts have been made to use spectrophotometers but only gross spectral analysis can be performed due to the large sampling area of the instruments. This can lead to spectral artifacts due to the cut of the gemstone and will not enable the gemologist to measure color variations within the stone itself.
Using a Microspectrophotmeter to Quantify Color in Gemstones
This paper describes a technique that utilizes a microspectrophotometer to quantify the color of gemstone with greater accuracy and precision than the human eye or a standard spectrophotometer. With standard sampling techniques, a microspectrophotometer would show many spectral artifacts due to the stone’s cut (for example the sparkle would interfere with accurate and consistent spectra). However, with this novel sampling technique, the optical artifacts caused by the cut of the stone are eliminated by suspending it in a bath of liquid with a refractive index that matches that of the stone. This allows the gemologist to measure the color of microscopic portions of the stone. In time, this will aid not only in the identification of the types of the stones but possibly in the identification of individual stones.
Experimental
Two types of stones of similar physical characteristics were used in the analysis. A third party identified these as blue and purple spinels and blue, red and purple sapphire. Sapphire is also known as corundum. All stones were faceted and cut in a standard manner. Spinels have a refractive index of 1.715 and have a general chemical composition of AB2O4 with MgAl2O4 being the most common. Trace elements replacing A or B impart color in these minerals. Corundum has a refractive index of 1.767 and a general chemical composition of A2O3. Al2O3 is the most common and trace elements replacing Al impart the colors in these stones.
QDI 2000™ UV-Visible-NIR Microscope Spectrophotometer
The instrument used for the analysis was a QDI 2000™ UV-visible-NIR microscope spectrophotometer from CRAIC Technologies, Altadena, California. See Figure 1. This microspectrophotometer has a spectral range of 200 to 1000 nm. In all cases 50 scans were averaged and a sampling area of 10x10 micrometers was used. The instrumental calibration was checked with NIST traceable microspectrophotometer standards, which are also a product of CRAIC Technologies, Altadena, California.
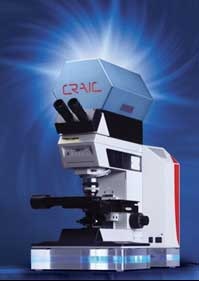
Figure 1. QDI 2000 Microspectrophotometer from CRAIC Technologies.
Rig for Testing Refractive Index
A well slide was made by gluing a glass ring to a quartz slide (CRAIC Technologies, Altadena, CA). See Figure 2. Each well slide had one of three refractive index liquids in the well. These consisted of two M-Series Cargille liquids selected to match the refractive index of spinels and corundum. Cargille 1.7200 and Cargille 1.7700 were selected to most closely match the refractive indices of spinel and corundum, respectively. Glycerin was also used due to its extended spectral range. However, glycerin only has a refractive index of 1.47, which meant that the stones still exhibited spectral artifacts that most often appeared as a lower signal-to-noise ratio (SNR) compared to that of the Cargille liquids.
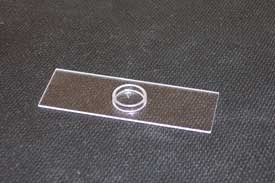
Figure 2. Quartz well slide used in experiments.
Results
Spectral Range of Glycerin and Cargille Liquids
The first step was to test the spectral range of each of the liquids. Both of the Cargille liquids have a brown tint that became more pronounced with exposure to ultraviolet light. This meant that the spectral range that could be transmitted through the liquid decreased over time. The transmission spectra of fresh liquids are shown in Figure 3. This shows that the Cargille liquids do not transmit any UV light but have higher transmission in the visible and NIR regions compared to glycerin.
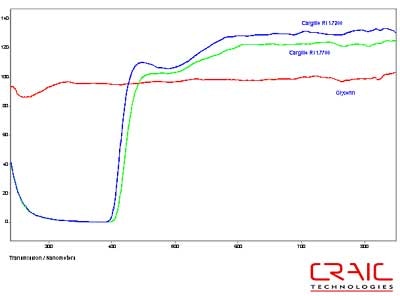
Figure 3. Spectra of Glycerin and two Cargille RI liquids.
Absorbance Spectra for the Blue Spinel
The spinels were analyzed first. The first stone was blue and faceted in a standard round cut. The stone was analyzed both in Glycerin and Cargille 1.7200 liquids. See Figure 4. As shown in this stacked plot, the Cargille has a better signal-to-noise ratio due to the better matching of the refractive index. However, it is limited only to the visible range as the liquid itself absorbs UV light. In Figure 5, we see that the glycerin enable spectral analysis of the stone down to 300 nm before the stone itself exhibited a very high absorbance coefficient. Please note that some of the variation in the spectra is due to the fact that the measurements were made in different locations on the stone in each liquid.
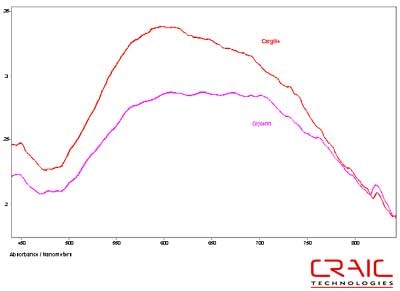
Figure 4. Absorbance spectra of Spinel #1 in Glycerin and Cargille 1.720
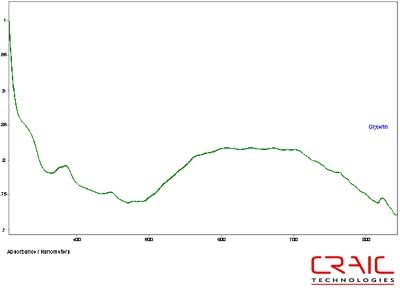
Figure 5. Absorbance spectrum of Spinel #1 in glycerin.
Absorbance Spectra for the Purple-Red Spinel
The second spinel was also faceted and had a purple-red coloration. It was analyzed in both Cargille RI liquids and in glycerin. The results are shown in the stack plot Figure 6. As seen in the plot, the best SNR was with the Cargille liquids but as seen in Figure 7, the UV data can only be obtained with the glycerin. Please note that some of the variation in the spectra is due to the fact that the measurements were made in different locations on the stone in each liquid.
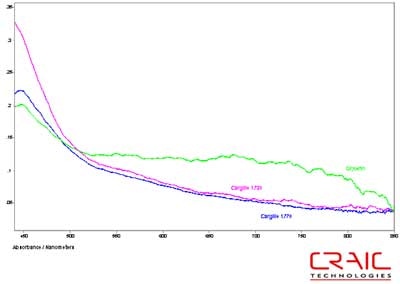
Figure 6. Absorbance spectra of Spinel #2 in both Cargille liquids and glycerin.
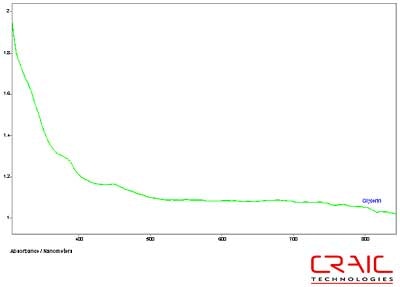
Figure 7. Absorbance spectrum of Spinel #2 in glycerin.
Absorbance Spectra for Sapphires
The next series of stones were sapphires. The first faceted sapphire was a blue. As before, Figure 8 shows that the SNR is superior with the Cargille liquid but the spectral range is substantially greater with the glycerin, as shown in Figure 9. Please note that some of the variation in the spectra is due to the fact that the measurements were made in different locations on the stone in each liquid.
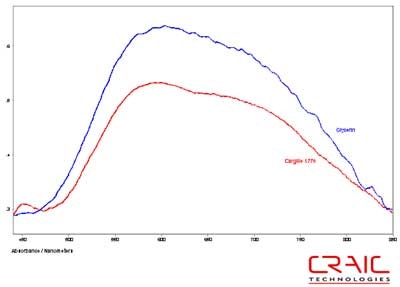
Figure 8. Absorbance spectra of Sapphire #1 in Cargille 1.770 and glycerin.
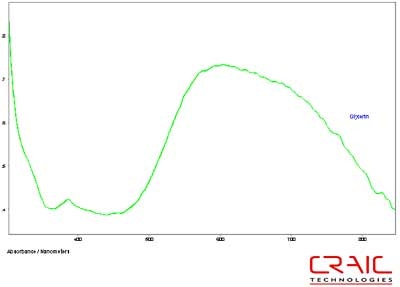
Figure 9. Absorbance spectrum of Sapphire #1 in glycerin.
The second faceted sapphire was also blue and it spectrum is shown in Figure 10. It is interesting to note that the 1.7700 liquid actually has the lowest SNR of the three spectra. This is because the liquid had degraded rapidly under intense UV illumination. Even though the 1.7700 liquid better matched the refractive index of the stone, its degradation led to poor transmission characteristics and made it a less than optimal media. Figure 11 shows the UV-visible spectrum of the second sapphire while in glycerin. Please note that some of the variation in the spectra is due to the fact that the measurements were made in different locations on the stone in each liquid.
Figure 10. Absorbance spectra of Sapphire #2 in both Cargille liquids and glycerin.
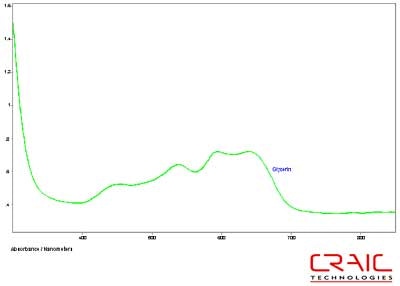
Figure 11. Absorbance spectrum of Sapphire #2 in glycerin.
The third faceted sapphire was also blue. Figure 12 shows the Cargille liquid spectrum has superior SNR to the glycerin spectrum. However, Figure 13 shows the superior spectral range of glycerin. Please note that some of the variation in the spectra is due to the fact that the measurements were made in different locations on the stone in each liquid.
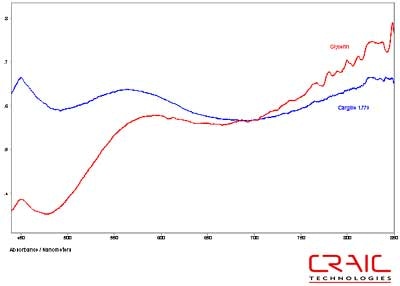
Figure 12. Absorbance spectra of Sapphire #3 in Cargille liquid and glycerin.
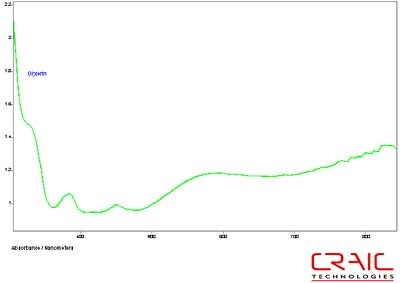
Figure 13. Absorbance spectrum of Sapphire #3 in glycerin.
Conclusions
In this paper, a new technique for the microspectroscopic analysis of faceted gemstones has been developed. If the stones are immersed in liquids with a comparable refractive index and then analyzed by a UV-visible microspectrophotometer in transmission mode, high quality spectra can be obtained.
It was found that the choice of the refractive index liquid played a dramatic role in the results obtained from the microspectrophotometer. The highest signal-to-noise ratio spectra with the least artifacts caused by the stone faceting were obtained with liquids that most closely matched the refractive index of the stone. However, the Cargille M-series refractive index liquids that were used degraded rapidly and underwent changes in color that dramatically reduced their effective spectral range in the blue region.
Glycerin was also tested for its effectiveness. Because its refractive index did not match that of the stones closely, the SNR was lower and that spectral artifacts sometimes appeared unless one was careful about the orientation and positioning of the stone. However, glycerin did not degrade over time and had a spectral range that extended deep into the ultraviolet region. Another factor is that glycerin is water soluble and easily removed from the gemstones. This factor is useful when analyzing precious stones.
Microspectroscopy of cut gemstones is possible if the stones are analyzed in a bath of a liquid that closely matches the refractive index of the stone. The more closely the refractive index of the stone matches that of the liquid, the better the quality of the spectrum. If Cargille refractive index liquids are used, they must be fresh in order to obtain the maximum spectral range and in any case these are only useful for color analysis. Glycerin must be used if UV analysis is also required in conjunction to color analysis. While the glycerin immersion based spectra tend to have a lower signal-to-noise ratio, the spectral range and durability of the media make it easier to use.
|