CRAIC Technologies is the worlds leading developer of UV-visible-NIR range scientific instruments for microanalysis. These include the 2030PV PRO™ UV-visible-NIR microspectrophotometer designed to help you non-destructively measure the optical spectra of microscopic samples. CRAIC's UVM-1 deep ultraviolet microscopes cover the UV, visible and NIR range and help you analyze with sub-micron resolutions far beyond the visible range. CRAIC Technologies also has the Apollo M confocal Raman microspectrometer for non-destructive analysis of microscopic samples.
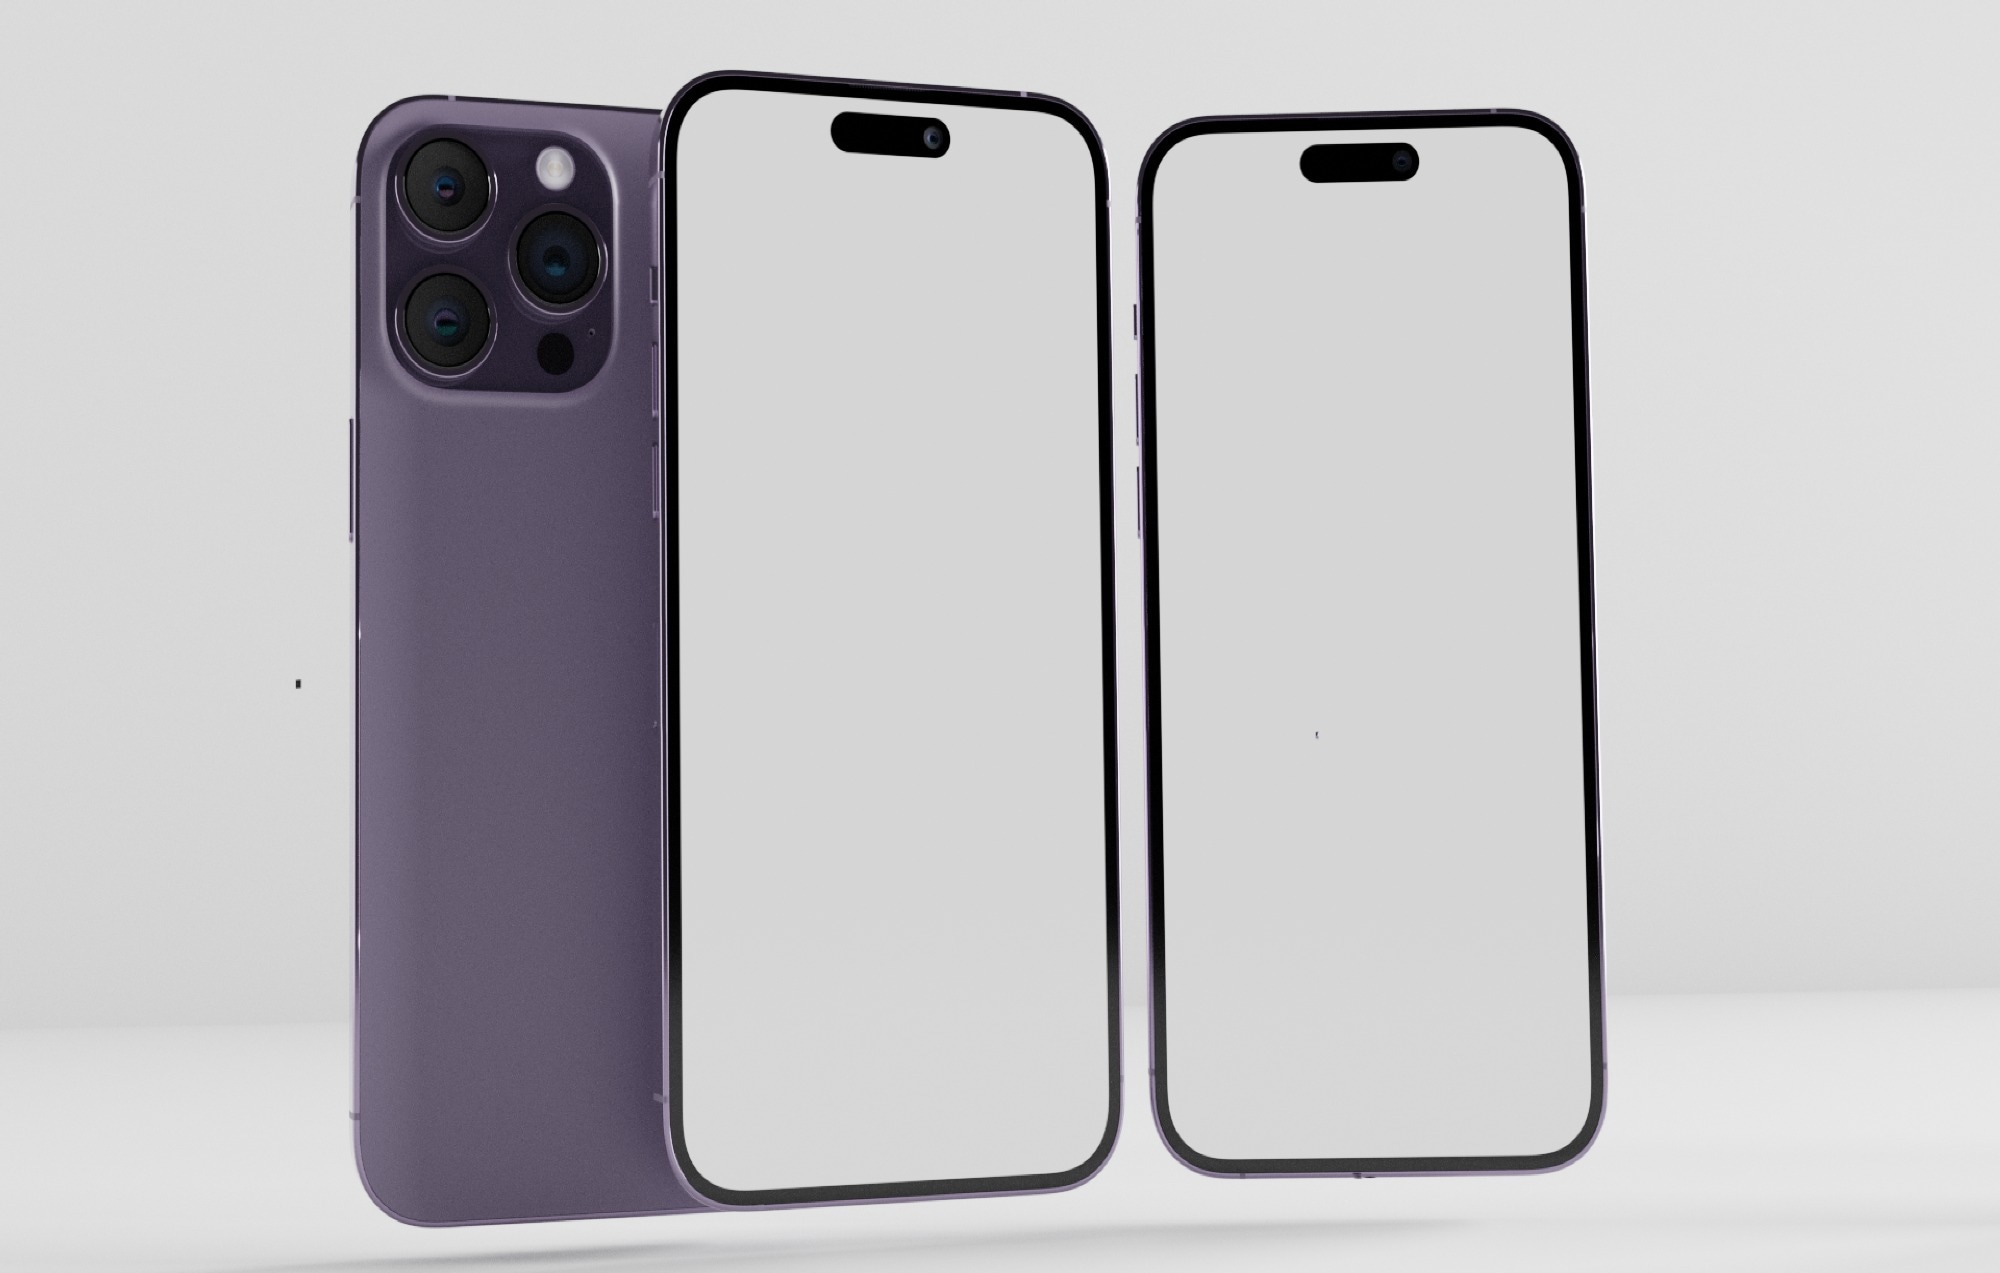
Image Credit: Shutterstock/irwan syahputra22
Development of Organic Light Emitting Diodes (OLEDs)
Organic Light Emitting Diodes (OLEDs) displays are commonly used in modern, high-end mobile phones. They are called organic as they use organic molecules as light sources. These molecules are electroluminescent as they emit light when an electric current is applied. Since these compounds these compounds emit light and with different colors, they are ideal as pixels in modern flat panel displays.
OLEDs have many advantages over traditional displays as they do not require backlight and therefore weigh less and use less energy. Pixels are divided into Red, Green and Blue and these pixels are getting smaller and smaller as the technology advances. Modern OLED displays offer increased brightness and allow wider viewing angle up to 160°. They also have faster response time making them ideal for rapid image changes such as those found in video games. However, the pixels are microscopic in size and so, it is difficult to quantify their intensity and color relative to one another using current visual and imaging instruments. This also makes it difficult to locate individual defective pixels as they can't be seen by the naked eye.
Emission Microspectroscopy Analysis of OLED Pixels
The 508PV™ microscope spectrophotometer from CRAIC Technologies provides a perfect solution with a quick, easy and non-destructive way of studying the emission microspectroscopy of each OLED pixel. The 508PV™ can be attached to a probe station, a standard microscope or integrated with in-line instrumentation. Using programmable stages, autofocus and CRAIC's Spectral Surface Mapping™ software, each pixel in the flat panel display can be measured for both intensity and color accuracy automatically at a hyperspectral map can be created showing both the intensity and color spectra of each pixel.
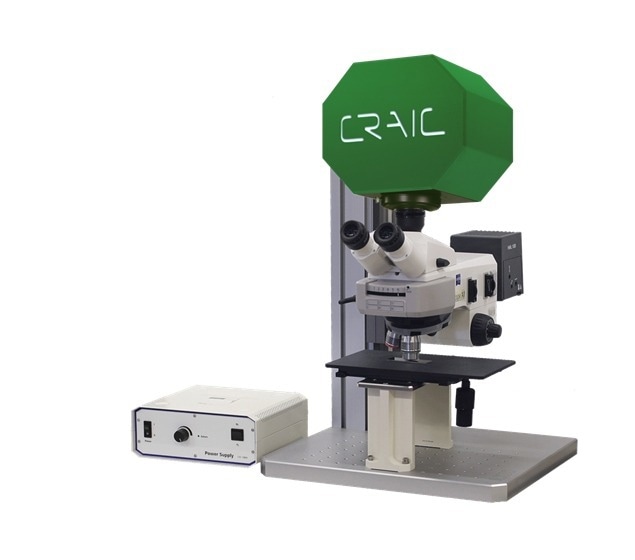
Image Credit: The 508PV™ microscope spectrophotometer from CRAIC Technologies. This instrument can be configured for transmission, reflectance, and emission microspectroscopy and imaging on an optical microscope or probe station
Studying the Emission Spectra of OLED Display Using A Spectrophotometer
Spectrophotometer is used to sample an OLED display with aperture-size smaller than the pixel in order to study the absorption spectroscopy. The spectrum in a wide range of 350 to 900 nm is plotted in Figure 2, which brings out distinct characteristics of each pixel. A comparison of such measurements with that of a good ‘standard’ quality pixel would reveal whether any degradation of color or quality has happened to the test sample.
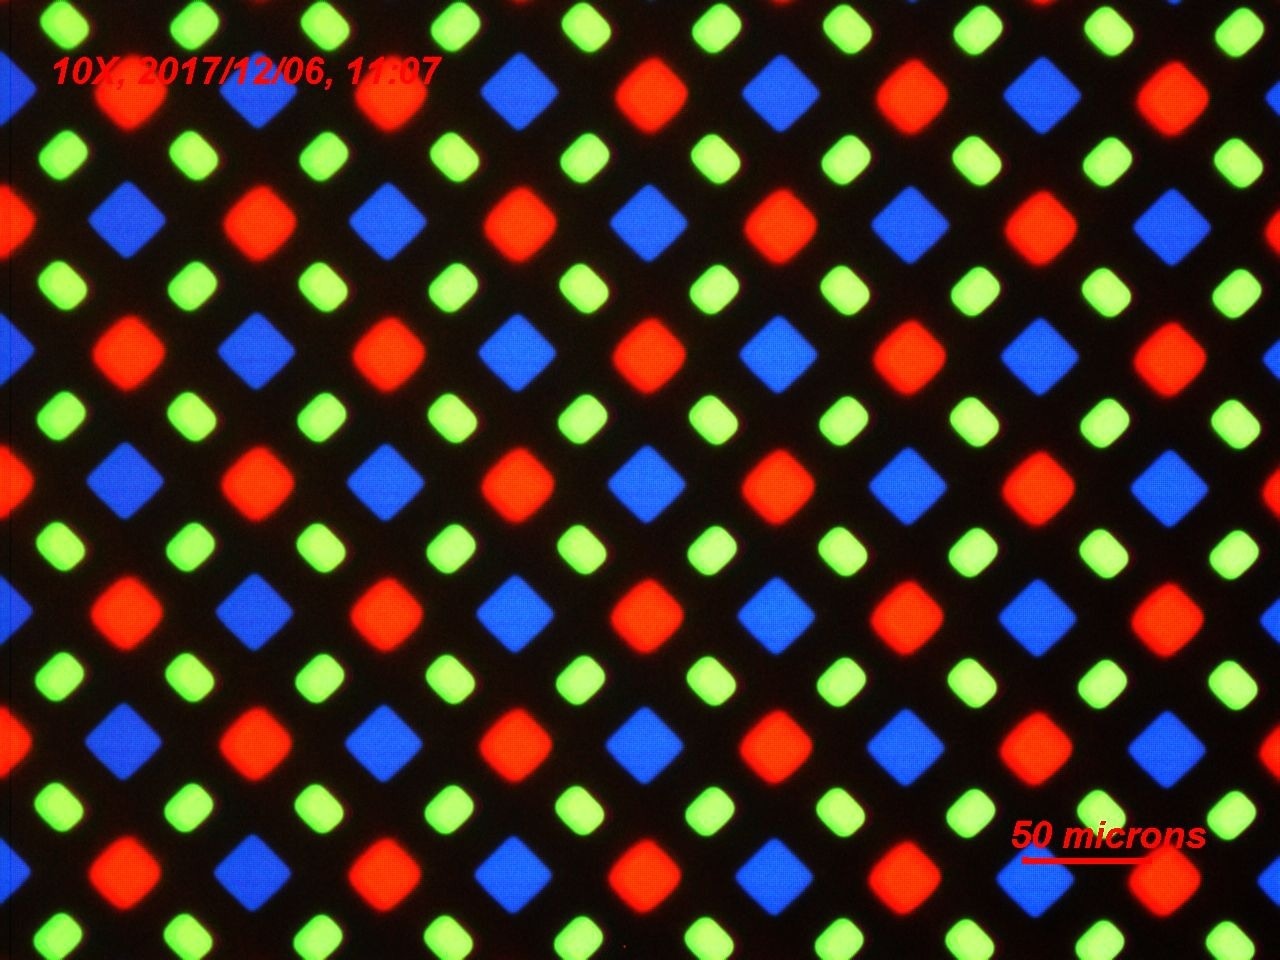
Figure1 : Image Credit: Image of OLED display taken with a 508PV microscope spectrometer
Figure 2: Image Credit: Emission Spectra of red, blue and green OLED pixels
In addtion to measuring the spectra and images of emissive displays, the 508PV™ can also be configured for both reflectance and transmittance so that even transmissive displays can be monitored during color quality control of the displays. Additional software such as CRAIC's ColorPro™ can calculate the colorimetric coordinates for each individual pixel. Thin film thickness can also be determined using CRAIC’s FilmPro™ software. Additionally, groups of pixels can be analyzed to determine the presence of mura in display units and the process can be automated.

This information has been sourced, reviewed and adapted from materials provided by CRAIC Technologies.
For more information on this source, please visit CRAIC Technologies.