Zeta potential is an indicative measure of the stability of a dispersion. The surface chemistry of the solid particles influences the zeta potential of any dispersion. It is possible to modify the surface chemistry by altering the pH, surfactant concentrations, salt concentration and other formulation options.
Hence, it is important to determine how pH affects the zeta potential of dispersion. By studying the isoelectric point, one can determine how pH affects zeta potential and can determine at which pH the zeta potential is zero.
Introduction
Zeta potential may be defined as the potential difference between the dispersion medium and the stationary layer of fluid attached to the dispersed particle as shown in Figure 1.
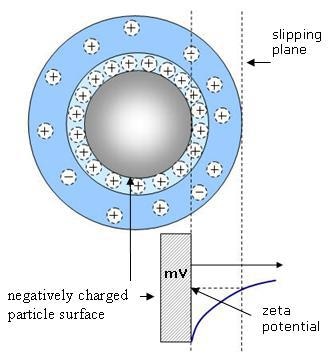
Figure 1. Zeta potential of a negatively charged particle
As per general colloid chemistry principles, an electrostatically stabilized dispersion system loses stability when the magnitude or the absolute value of the zeta potential decreases to less than approximately 30 mV. As a result, there will be some region surrounding the condition of zero zeta potential such as the isoelectric point, or IEP for which the system is not specifically stable. Within this unstable region, the particles may agglomerate, thus increasing the particle size. Determining the pH conditions where the zeta potential becomes zero is a common use for zeta potential analyzers.
Materials
Two samples have been analyzed for this study, noted as creamer A and creamer B. Both are powders are used as an alternative for cream in coffee. Both samples were dispersed in 18 megohm DI water. The titration was performed using 1 N HCl and 1 N KOH solutions. The pH was measured utilizing a HORIBA model F-50 pH meter. The sample becomes an emulsion, once it is added to the water. The particle size distribution of the emulsion from sample B was analyzed using both the SZ-100 DLS system and the LA-950 laser diffraction particle size analyzer. The large particle size and polydispersity index from the SZ-100 result signified the presence of large particles outside the range of any DLS system. This was confirmed by the particle size result recorder by the LA-950 as shown in Table 1.
Table 1. Particle size distribution of sample B determined with the LA-950
| D10 |
0.127 μm |
| D50 |
0.284 μm |
| D90 |
14.29 μm |
Experimental Procedure
The zeta potential of both the samples was analyzed using the HORIBA SZ-100 nanoPartica system as shown in Figure 2.
Figure 2. The SZ-100 nanoPartica system
Sample Preparation
The sample preparation procedure for both samples was identical and included the following steps:
- Add 100 ml of DI water into a beaker
- Add 0.1 g of sample to the water
- Agitate for 5 minutes, after which this becomes the base sample to be titrated
The titration was performed manually following this procedure:
- Extract a 10 mL of the base sample using a disposable pipette into a glass beaker.
- Add a few drops of HCl to reduce the pH or KOH to raise the pH to reach the desired pH.
- Extract a few mL of the sample with a disposable pipette and fill the disposable zeta potential cell without introducing bubbles.
- Place the zeta potential cell into the SZ-100.
- Measure the zeta potential three times and record the average value.
The SZ-100 was placed in zeta potential measurement mode, the same system is also capable of measuring particle size, molecular weight, and the second virial coefficient. The settings for the measurements were:
Smoluchowski assumption for κa
Measurement duration = 120 sec
Standard calculation
Results and Discussion
The pH vs. zeta potential plot for sample A and B is shown in Figure 3. The IEP of the sample A was measured to be 4.1 and for sample B the IEP was never attained. The value for sample A was close to the anticipated value based on past experience with this sample. The data for sample B was confusing until the ingredient list was read and the long list of stabilizers added to this product was realized.
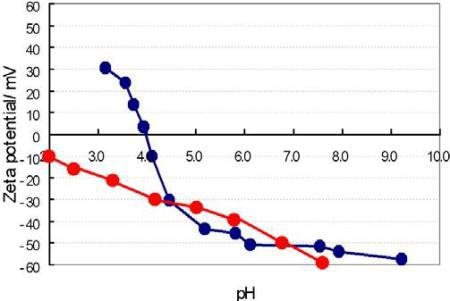
Figure 3. Zeta potential vs. pH graph. Sample A in blue, sample B in red.
A rapid study of zeta potential measurement reproducibility was then done on sample B. The base sample was analyzed five times as shown in Table 2 and then another identical sample preparation procedure was carried out and this sample was analyzed five times as shown in Table 3. Note that the reported zeta potential value is concentration dependent, which is why these values are higher than was seen in the IEP study.
Table 2. Zeta potential repeatability sample B prep #1
| Run # |
Zeta Potential |
| 1 |
-81,2 |
| 2 |
-80,5 |
| 3 |
-81,6 |
| 4 |
-79,9 |
| 5 |
-80,7 |
| ave |
-80,8 |
| st dev |
0,65 |
| COV |
0,81 |
Table 3. Zeta potential repeatability sample B prep #2
| Run # |
Zeta Potential |
| 1 |
-81,2 |
| 2 |
-79,5 |
| 3 |
-81,6 |
| 4 |
-80,1 |
| 5 |
-79,6 |
| ave |
-80,4 |
| st dev |
0,95 |
| COV |
1,18 |
IEP studies have been published for a variety of samples. Table 4 shows a quick reference to the IEP for many samples. This table is meant for quick reference only and is not intended as a comprehensive or complete list of IEP values. Note further that surface chemistry or structure of some materials can be quite different from bulk chemistry. This is most clear for the case of rutile vs anatase TiO2.
Table 4. IEP values for a variety of materials
| alpha aluminium oxide Al2O3 |
8-9 |
| alpha iron (III) oxide (hematite) Fe2O3 |
8.4-8.5 |
| antimony(V) oxide Sb2O5 |
<0.4 to 1.9 |
| cerium(IV) oxide (ceria) CeO2 |
6.7-8.6 |
| chromium(III) oxide (chromia) Cr2O3 |
6.2-8.1 |
| copper(II) oxide CuO |
9.5 |
| delta-MnO2 1.5, beta-MnO2 |
7.3 |
| gamma aluminium oxide Al2O3 |
7-8 |
| gamma iron (III) oxide (maghemite) Fe2O3 |
3.3-6.7 |
| iron (II, III) oxide (magnetite) Fe3O4 |
6.5-6.8 |
| lanthanum(III) oxide La2O3 |
10 |
| lead(II) oxide PbO |
10.7-11.6 |
| magnesium oxide (magnesia) MgO |
9.8-12.7 |
| manganese(IV) oxide MnO2 |
4-5 |
| nickel(II) oxide NiO |
9.9-11.3 |
| silicon carbide (alpha) SiC |
2-3.5 |
| silicon dioxide (silica) SiO2 |
1.7-3.5 |
| silicon nitride Si3N4 |
6-7 |
| silicon nitride Si3N4 |
9 |
| tantalum(V) oxide, Ta2O5 |
2.7-3.0 |
| thallium(I) oxide Tl2O: |
8 |
| tin(IV) oxide SnO2 |
4-5.5 |
| titanium(IV) oxide (rutile or anatase) TiO2 |
3.9-8.2 |
| tungsten(VI) oxide WO3 |
0.2-0.5 |
| vanadium(V) oxide (vanadia) V2O5 |
1 to 2 |
| yttrium(III) oxide (yttria) Y2O3 |
7.2-8.9 |
| zinc oxide ZnO |
8.7-10.3 |
| zirconium(IV) oxide (zirconia) ZrO2 |
4-11 |
| |
|
Conclusions
The isoelectric point of two emulsion samples was analyzed by determining zeta potential as a function of pH using a HORIBA SZ-100 DLS. The reproducibility of sample B was then studied and showed excellent agreement between two sample preparations.

This information has been sourced, reviewed and adapted from materials provided by HORIBA.
For more information on this source, please visit HORIBA.