The unique properties and varied use of graphene has created interest for the study of graphene. Only graphene films with a few layers exhibit interesting unusual properties. The layer thickness of graphene films can be efficiently determined by Raman spectroscopy.
Raman Spectroscopy and the Raman Spectrum of Graphene
Raman spectroscopy, sensitive to geometric structures is used in the study of allotropes of carbon as they differ only in the nature of bonding and position of the carbon atoms. It is also capable of differentiating multilayer graphenes and also the atomic layer resolution for the thickness up to four layers. The spectra exhibit simple structures characterized by two principle bands G and 2D bands (a third D band, if there are defects in the carbon lattice). When scrutinized closely, these subtle differences supply important information. Figure 1 shows the Raman spectra of graphene and graphite.
-1.jpg)
Figure 1. The Raman spectra of graphite and angle layer graphene, collected with 532 nm excitation.
The G Band
The sharp band appearing around 1587 cm-1 in the spectrum of graphene is the G band, in-plane vibrational mode that involves sp2 hybridized carbon atoms that comprises the graphene sheet. The observed position and predictable behavior of this band help to determine the layer thickness as the G band position is highly sensitive to the number of layers present in the sample (see Figure 2). The band position can also be effected even by small amounts of strain present on the sample, doping and temperature whereas the intensity is less susceptible to these factors. Hence, one must be cautious when attempting to use the position of this band to determine graphene layer thickness whereas intensity with these environmental factors are more reliable. Figure 3 shows spectra of single, double, and triple layer graphene.
-1.jpg)
Figure 2. The G band position as a function of layer thickness. As the number of layers increase the band shifts to lower wavenumber, collected with 532 nm excitation.
-1.jpg)
Figure 3. There is a linear increase in G band intensity as the number of graphene layers increases, collected with 532 nm excitation.
The D Band
A ring breathing mode from sp2 carbon rings represents the D band, the disorder or the defect band. The ring must be near a graphene edge or a defect to be active. This band is generally weak in graphite and high-quality graphene. Only defected materials have a significant D band and also have a resonant band with dispersive behavior. Hence, it is important to use the same excitation laser frequency for all measurements if the D band is used as both the position and the shape of the band can vary significantly with different excitation laser frequencies.
The 2D Band
The second-order D band, the result of a two phonon lattice vibrational process is the final band, the 2D band. Unlike the D band, the proximity to a defect does not activate it. Hence the 2D band is always a strong band in graphene even when there is no D band present and does not represent defects. Unlike the G band position method, the 2D band method depends on band position and band shape.
Figure 4 shows the differences between the layers in this band. The distinct band shape differences allow the 2D band to be effective in differentiating the layer thickness between single and multilayer graphene of less than four layers.
The position and shape of the band can be significantly different with different excitation laser frequencies as the 2D band is also resonant and exhibits strong dispersive behavior. Hence like the D band it is important to use the same excitation laser frequency for all measurements when performing characterization with the 2D band.
-1.jpg)
Figure 4. The 2D band exhibits distinct band shape differences with the number of layers present.
Single layer graphene can also be identified by analyzing the peak intensity ratio of the 2D and G bands as in Figure 5. The ratio I2D/IG of these bands for high quality (defect free) single layer graphene will be equal to 2. This ratio, lack of a D band and a sharp symmetric 2D is a confirmation for a high quality defect-free graphene sample.
-1.jpg)
Figure 5. Single layer graphene can be identified by the intensity ratio of the 2D to G band.
Instrumental Considerations
The important points to be considered for selecting a Raman instrument are:
- Microscopy capabilities as the graphene samples are usually very small.
- The excitation laser selected must be visible, i.e., 633 or 532 nm laser.
- High wave number precision with high resolution to ensure the accuracy of observation even in small wave number shifts and also to adjust power in small increments.
- Automated stage and associated software to generate Raman point maps.
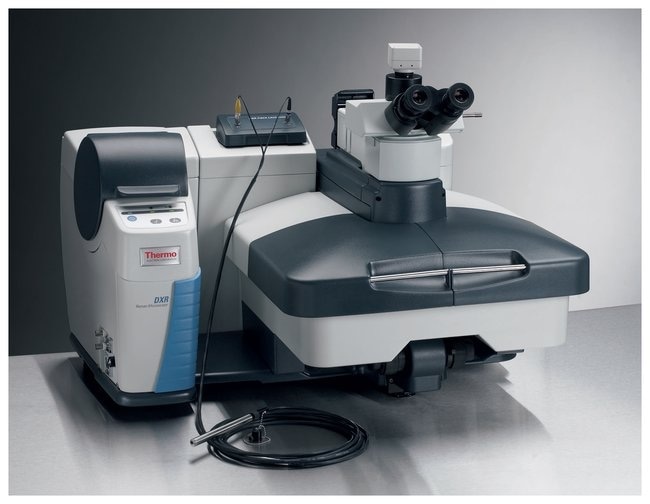
The DXR 2 Raman systems provides exceptional ability to fine tune laser power as they have a unique device, laser power regulator which maintains laser power with unprecedented accuracy which could be optimized for each experiment.
The Raman Mapping of Graphene
If an automated stage is integrated into the Raman microscope, Raman maps or images can be obtained from the sample. The Raman mapping entails the coordinated measurement of Raman spectra with successive movements The results of a Raman map measurement using Thermo Scientific OMNIC Atlμs mapping software is shown in Figure 6.
-1.jpg)
Figure 6. Raman spectra of graphene at specific locations exhibiting differences in layer thickness
The presence and distribution of regions in the map that differ in graphene layer thickness can be determined by powerful processing tools, such discriminant analysis in OMNIC™ Atlμs™ software and Thermo Scientific TQ Analyst software. A standard spectra for the different layer thicknesses is employed as a calibration set. The 2D band with its band shape differences is used in the discriminant analysis as distinct differences exist. Figure 7 shows the results of the discriminant analysis applied to this map. It shows that the sample under investigation was composed of single, double, triple, and multilayer graphene regions across the sample.
Conclusions
The Thermo Scientific DXR 2 Raman microscope is an ideal Raman instrument for grapheme characterization as it provides high level of stability, control, and sensitivity needed to produce confident results. No other techniques provide as much information about the structure of graphene samples as Raman spectroscopy. Raman spectroscopy is a great tool for the characterization of graphene, especially in layer thickness.
![]()

This information has been sourced, reviewed and adapted from materials provided by Thermo Fisher Scientific – Materials & Structural Analysis.
For more information on this source, please visit Thermo Fisher Scientific – Materials & Structural Analysis.