Thermogravimetric analysis (TGA) is a robust approach which has been used in the characterization of solid and liquid samples for quite some time.
Image Credit: Shutterstock/Dmitry Kalinovsky
The analysis involves monitoring of the mass of the sample when it is heated. By precisely controlling the heating process, the resulting mass loss is accurately measured using a high precision balance as a function of temperature. TGA is generally utilized in the analysis of petrochemicals, pharmaceuticals, and polymers for monitoring moisture and solvent content, characterizing thermal decomposition, and determining degradation temperatures.
Additional data about thermal behavior and sample composition can be acquired through the analysis of the gases that generate during the material heating, thus enabling researchers to determine the temperature at which the mass loss takes place as well as the molecular structures involved. Evolved gas analysis (EGA) is typically performed by means of many different analytical methods.
Nevertheless, in all approaches, it is necessary to protect the integrity of the gas stream. Moreover, the gas must be maintained in high temperature conditions and rapidly transferred to the gas analyzer to prevent the occurrence of chemical interactions and condensation.
Experimental Setup
The experimental setup involves the use of the TG 209 F1 Libra, a vacuum-tight TGA from NETZSCH, and the MAX300-EGA, a quadrupole mass spectrometer from Process Insights. The NETZSCH TG 209 F1 Libra features an automatic sample changer and is capable of attaining temperatures as high as 1100 °C. It measures the mass of a sample to a resolution of 0.1 µg. Its heated adapter was attached to the transfer line of the Process Insights MAX300-EGA. The interface is heated to 200 °C to avoid condensation and differentially pumped for rapid clearing, thus providing a low volume, chemically inert sample path from the TGA all the way through to the ionizer of the mass spectrometer.
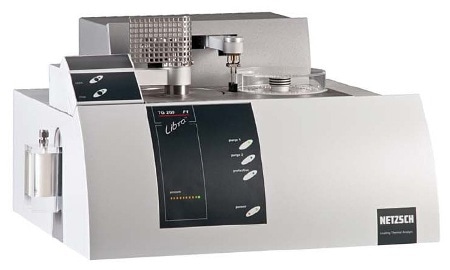
Figure 1. The NETZSCH TG 209 F1 Libra configured with the heated off-gas assembly.
The MAX300-EGA is designed for evolved gas analysis in a laboratory setup and can scan from 1 to 200 amu. It is equipped with the Process Insights 19 mm mass filter to achieve long term stability and high analytical repeatability. The Questor5 software enables the system to carry out quantitative analysis, or qualitative analysis for sample characterization by measuring concentrations from 100 % down to 10 ppb. Besides the transfer line, the MAX300-EGA can import a start-of-heating signal from the TGA. It is possible to configure the MAX300-EGA to execute calculations and trend data, or generate the data for observation and manipulation on a different platform.
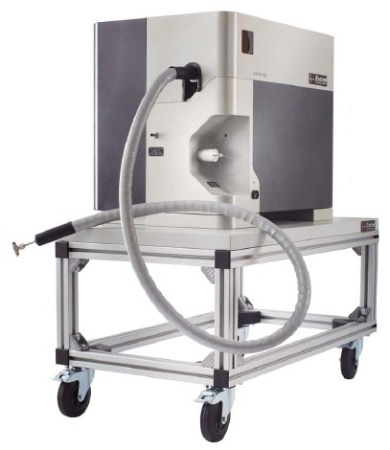
Figure 2. The MAX300-EGA, a quadrupole mass spectrometer optimized for evolved gas analysis.
Polystyrene Decomposition: Detection of High-Mass Fragments
The Libra’s furnace was filled with 0.94 mg of polystyrene and then heated to above 600 °C. The sample breakdown was observed to assess the sensitivity of the MAX300 to the small signals produced by high-mass hydrocarbons in the off-gas. Although the decomposition of the polystyrene was recorded by the TGA as a single weight loss starting at 290 °C, the MAX300 was able to show the occurrence of the evolution of several compounds, as shown in Figure 3A.
It is a challenging task to maintain larger molecules from dropping out of an evolved sample after its exit from the furnace. Nevertheless, the mass spectrum at 39.75 minutes confirms the presence of styrene in the off-gas, as shown in Figure 3B, and the small signals produced by methyl styrene, as shown in Figure 3C.
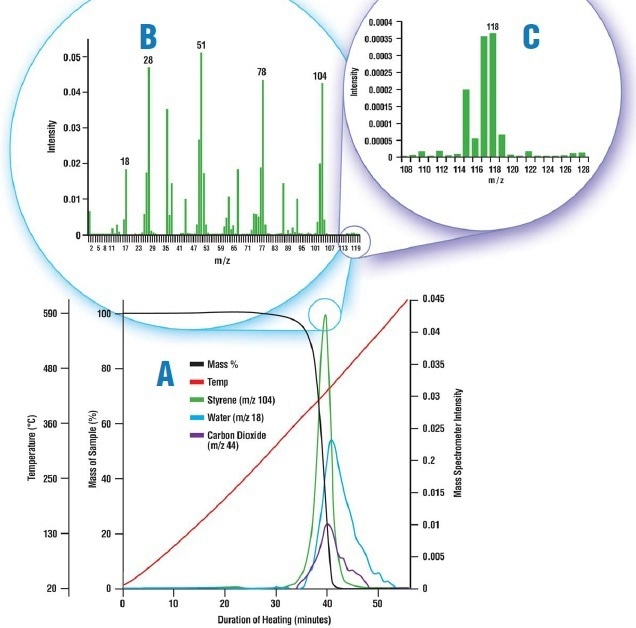
Figure 3. The thermal decomposition of polystyrene. A. Mass loss data from the TGA shown with the intensity trends from the mass spectrometer. Water and carbon dioxide are shown leaving the sample along with styrene. B. The mass spectrum of the evolved gas captured at 39.75 minutes. The peaks at m/z 18, 44, and 104 are from water, carbon dioxide, and styrene, respectively. C. A portion of the mass spectrum, rescaled. The peaks at m/z 115-128 are from a styrene molecule still bound to a methyl group that has broken off of the parent molecule.
Calcium Oxalate: Quantitation of the Evolved Gas
Then, the Libra was loaded with 0.51 mg of calcium oxalate and then heated to assess the capability of the MAX300-EGA to determine and quantify the components in the exhaust gas releasing form a microgram-level mass loss, as shown in Figure 4.
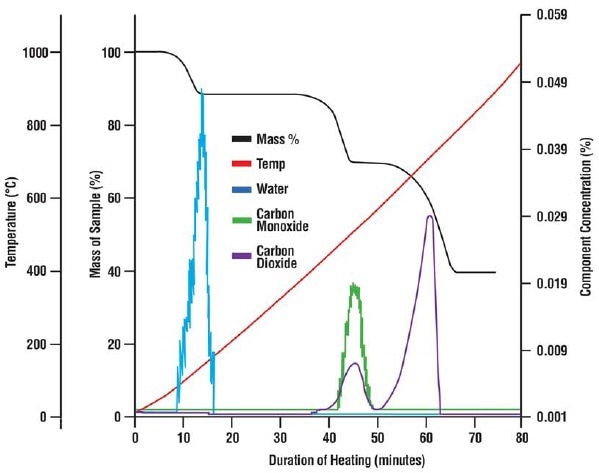
Figure 4. The mass loss of the calcium oxalate sample shown with thermal data and the composition of the off-gas as recorded by the mass spectrometer. Three weight losses occurred during the test which the mass spectrometer was able to identify as water, carbon monoxide and carbon dioxide.
The mass of each compound in the gas was computed for comparison to data from the TGA's balance, as shown in Table 1.
Table 1. The quantitative analysis mode of the MAX300-EGA was used to calculate the mass of each analyte in the off-gas. These values are shown with the mass loss measured by the TGA.
| MAX300-EGA |
|
Mass Loss (ug) |
| Component |
1 |
2 |
3 |
| Water |
60.05 |
- |
- |
| Carbon Monoxide |
- |
60.73 |
- |
| Carbon Dioxide |
- |
34.38 |
149.09 |
| Sum |
60.05 |
95.11 |
149.09 |
| TGA Data |
59.93 |
94.61 |
150.96 |
The mass spectrometer was able to measure even the comparatively small mass loss of 60 µg due to the release of moisture from the sample. The MAX300 also individually measured the quantity of the carbon dioxide and carbon monoxide that, combined, resulted in the second mass loss. By this way, the thermal breakdown of calcium oxalate was well documented.
Conclusion
The data acquired from the effluent of the TGA 209 F1 Libra confirms the capability of the MAX300-EGA in evolved gas analysis. The sensitivity, resolution and quantitation illustrated during the evaluations corroborate the mass spectrometer’s potential for other evolved gas applications. In its standard configuration, or in conjunction with the 300 or 400 °C transfer line upgrades, the MAX300 is able to monitor the gas leaving a microreactor, determine trace VOCs, and to quantify solvent loss in a pharmaceutical sample. The MAX300’s ability to perform quantitative separations can be utilized to gain insight into a complex decomposition involving the concurrent evolution of many different unknown compounds.

This information has been sourced, reviewed and adapted from materials provided by Process Insights - Mass Spectrometry.
For more information on this source, please visit Process Insights – Mass Spectrometers.