A binding partner is required for standard analytical methods of macro-molecular interactions, such as SPR and ELISA, for being immobilized on a surface for the quantification of the binding affinity. The equilibrium dissociation constants (KD) being measured are not greatly affected by this physical tethering for simple 1:1 association as well as for some 1:n interactions.
However, if both binding partners are multivalent, immobilizing one ligand can result in erroneous measurements of the binding affinity by orders of magnitude caused by mass transport limitations, avidity effects at the surface, and false assumptions about the stoichiometry of the interaction.
However, composition-gradient multi-angle light scattering (CG-MALS) performs interaction measurements entirely in solution, enabling prospective binding stoichiometries to take place and facilitating quantification of meta complex formation, self- and heterointeractions, and other multivalent interactions.
This article discusses the analysis of complex stoichiometries resulting from the binding of an antistreptavidin antibody (Ab) to the homotetramer streptavidin (SA).
Reagents and Instrumentation
The CG-MALS experimental procedure involved the dilution of streptavidin (Sigma-Aldrich) and anti-streptavidin antibody (Amgen) to a stock concentration of 10 µg/mL in a phosphate buffered saline (PBS; 25 mM NaH2PO4, 25 mM Na2HPO4, 50 mM NaCl, 200 ppm NaN3 pH 6.7) for a total of ~100 µg each protein per experiment. Then, Anotop syringe filters (Whatman) was used to filter each solution to 0.02 µm.
The resulting solutions were then fed into a Calypso II composition-gradient system from Wyatt Technology. The system prepared and provided various protein compositions and equipped with Wyatt DAWN HELEOS MALS detector and an inline UV/Vis detector (Waters), as shown in Figure 1.
The Calypso was installed with polycarbonate (Millipore) filter membranes having a pore size of 0.1 µm for sample and buffer filtration. The Calypso software was used to perform data collection and analysis of equilibrium association constants.
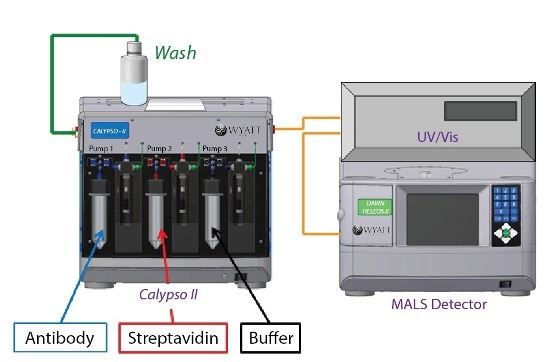
Figure 1. Calypso system hardware set-up with inline UV/Vis concentration detector and DAWN HELEOS MALS detector.
Results
The increased light scattering signal in the region of hetero-association gradient shows the association of SA and Ab into complexes with a molecular weight higher than a simple 1:1 or 2:1 stoichiometric ratio, as depicted in Figure 2. Since self-association was not possible for these proteins under these conditions, the multivalent nature of the two binding partners must be the cause of the higher-order stoichiometries.
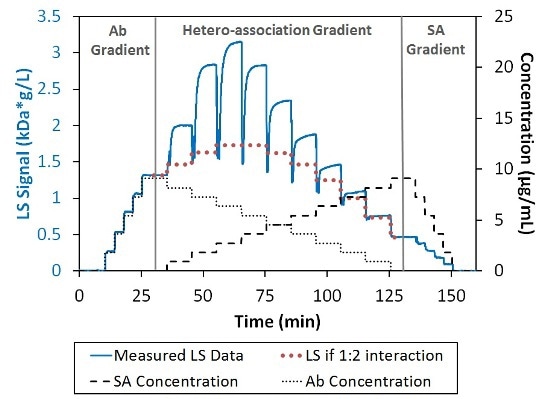
Figure 2. Light scattering and concentration data for the interaction between SA and Ab. The association is greater than can be explained by 1:2 interaction (bold-dotted red line).
In a ‘crossover’ hetero-association gradient, the composition with the optimum light scattering signal (weight average molar mass, Mw) takes place at the interaction’s overall stoichiometric ratio. This ratio coupled with the magnitude of Mw generates the absolute stoichiometry of the interaction. The comparison of the measured Mw to three simple SA:Ab stoichiometries is illustrated in Figure 3.
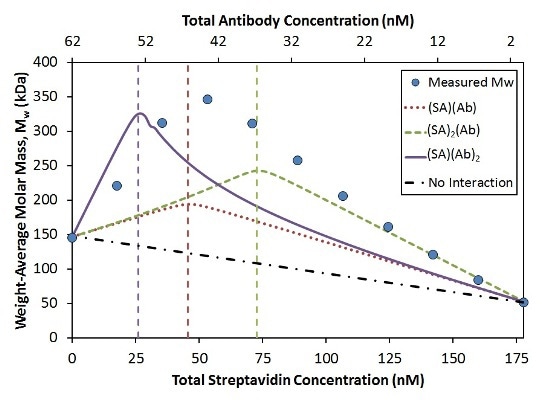
Figure 3. Measured Mw compared to simulated Mw for the indicated stoichiometries with KD = 0.2 nM at each binding site.
The position of the peak in the Mw measured shows that the largest complexes form with a stoichiometry ratio of n:n (dotted red line) compared to n:2n (solid purple line) or 2n:n (dashed green line). The affinity per binding site was considered constant (KD = 0.2 nM) for each model.
While the measured data achieve an optimum value near the 1:1 molar ratio, the maximum measured Mw (~350 kDa) is considerably greater when compared to the maximum molecular weight for the 1:1 model (~200 kDa).
A simulation considering two Ab bound per SA molecule reaches the correct maximum Mw (~330 kDa; Figure 3, solid purple line). Nevertheless, compared to the measured data, this optimum value takes place at the wrong composition. This simulated model drastically underestimates the measured Mw for all compositions containing excess SA.
In summary, these data show the existence of higher order complexes with an overall stoichiometric ratio of 1:1, i.e., (SA)2(Ab)2, (SA)3(Ab)3, etc. It may be a surprising result because the four possible binding sites SA when compared to the two on Ab indicate that complexes can take place with higher SA:Ab ratios, as depicted in Figure 4.
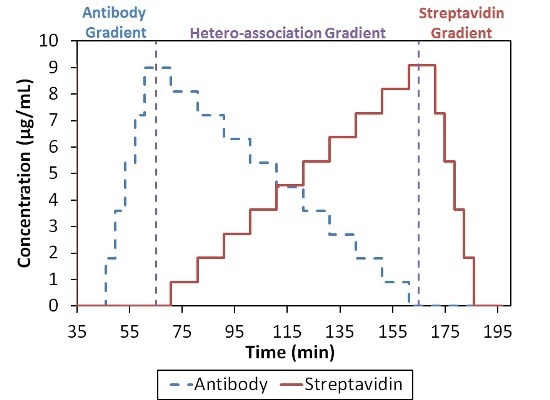
Figure 4. Composition-gradient method for quantifying the interaction between streptavidin and an anti-streptavidin antibody.
The complex which saturates most of the binding sites may have an overall stoichiometric ratio of 2(SA):1(Ab). Two different models are considered for the characterization of the SA-Ab interaction: infinite self-association of [(SA)(Ab)] base units into n:n complexes and a more refined analysis that includes n+1:n and n:n+1 complexes in addition to the n:n complexes.
First Pass Analysis: Infinite Self-Association (ISA) of 1:1 Stoichiometries [(SA)(Ab)]n
In accordance with this model, Ab binds SA with affinity KD = 22 nM, and the [(SA)(Ab)] base units self-assemble with KD = 50 nM. An additional term representing two antibodies that bind a streptavidin molecule (SA)(Ab)2 was needed to completely capture the variation in light scattering as a function of composition. Noticeable concentration of [(SA)(Ab)]n complexes is not available with n>3 under these conditions, as shown in Figure 5.
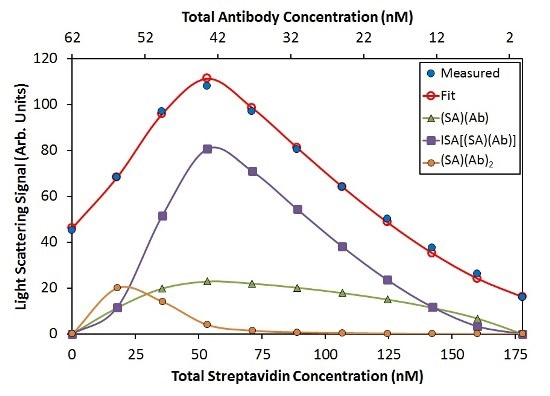
![Best fit of CG-MALS hetero-association data using the ISA model. Top: The best fit (red unfilled circles) for the measured light scattering data (blue filled circles) includes contributions from (SA) (Ab), (SA)(Ab)2, and ISA species. The purple squares give the overall contribution to the model by all species with stoichiometry [(SA) (Ab)]n with n/>1. Bottom: For each composition, the molar distribution of species in solution can be calculated. In both graphs, SA and Ab monomer contributions are left off for clarity.](https://d12oja0ew7x0i8.cloudfront.net/images/Article_Images/ImageForArticle_9765_450652488198726865147.jpg)
Figure 5. Best fit of CG-MALS hetero-association data using the ISA model. Top: The best fit (red unfilled circles) for the measured light scattering data (blue filled circles) includes contributions from (SA) (Ab), (SA)(Ab)2, and ISA species. The purple squares give the overall contribution to the model by all species with stoichiometry [(SA) (Ab)]n with n>1. Bottom: For each composition, the molar distribution of species in solution can be calculated. In both graphs, SA and Ab monomer contributions are left off for clarity.
Refined Analysis: Inclusion of All (SA)i(Ab)j, for i,j < 3
Although providing an appropriate fit to the data, the ISA model indicates that Ab binds SA with a lower affinity if the SA molecule is already attached to another Ab. Steric hindrance could explain this lower affinity for complex formation. A more comprehensive analysis incorporates the n+1:n and n:n+l complexes as well as the n:n complexes.
In this analysis, (SA)(Ab)2, (SA)2(Ab), and (SA)3(Ab)2 have a significant contribution to the total light scattering, as shown in Figure 6. Other stoichiometries, including (SA)2(Ab)3 and (SA)2(Ab)4, drop out of the fit have any contribution to the overall light scattering signal. This implies that it is more preferred to saturate the Ab binding sites with SA instead of the SA binding sites with Ab.
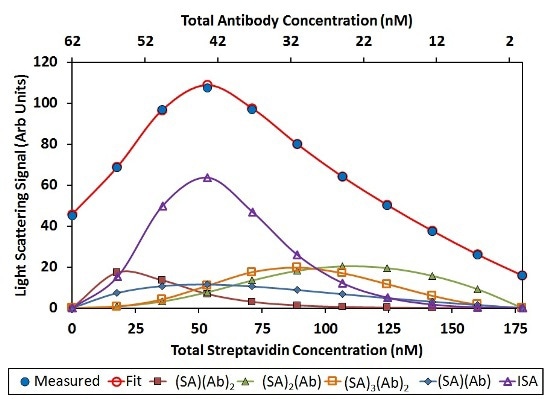
![Best fit of CG-MALS hetero-association data assuming arbitrary (SA)i(Ab)j stoichiometries. Left: The best fit (red unfilled circles) to the measured light scattering data (blue filled circles) is made up of a combination of the indicated stoichiometries. Right: Distribution of species across the hetero-association gradient. The n/>3 includes all stoichiometries [(SA)(Ab)]n with n>3. In both graphs, SA and Ab monomer contributions are left off for clarity.](https://d12oja0ew7x0i8.cloudfront.net/images/Article_Images/ImageForArticle_9765_45065248829884264610.jpg)
Figure 6. Best fit of CG-MALS hetero-association data assuming arbitrary (SA)i(Ab)j stoichiometries. Left: The best fit (red unfilled circles) to the measured light scattering data (blue filled circles) is made up of a combination of the indicated stoichiometries. Right: Distribution of species across the hetero-association gradient. The n>3 includes all stoichiometries [(SA)(Ab)]n with n>3. In both graphs, SA and Ab monomer contributions are left off for clarity.
This analysis results in KD values with a narrow range of 23±4 nM per binding site. The constant affinity per binding site demonstrates the absence of negative cooperativity affecting metacomplex formation as assumed by the ISA model. Moreover, this refined model’s residuals are tinier and more random when compared to those of the ISA model, as illustrated in Figure 7.
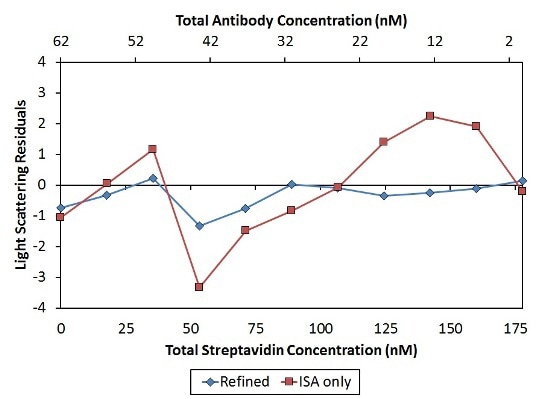
Figure 7. Residuals of the second, “Refined” model (blue diamonds) are smaller and more random than residuals of the first, “ISA only” model (red squares), indicating a better fit of the data.
Conclusion
The results show that CG-MALS is capable of analyzing metacomplex formation by multivalent binding partners in solution to acquire data on binding affinity and absolute stoichiometries. By performing this analysis, CG-MALS proves its ability to study complex systems of macromolecules in solution.

This information has been sourced, reviewed and adapted from materials provided by Wyatt Technology.
For more information on this source, please visit Wyatt Technology.