Vapor pressure is a fundamental physical property of a material. It is expressed as a function of temperature and there is a relationship between vapor pressure and the Gibbs free energy of the original solid/liquid material.
Handling materials such as pharmaceutical samples and pesticides requires knowledge of vapor pressure so that the atmospheric build-up of toxic compounds is avoided. It is necessary to register the vapor pressure of materials to the EC (European Community) or EPA (US Environmental Protection Agency).
Vapor pressure analyzers (VPAs) use the Knudsen effusion method for vapor pressure measurement of oils, liquids and solids. The Knudsen effusion method is a method approved by the Organization for Economic Cooperation and Development and is mentioned in its Vapor Pressure OECD/OCDE Guideline 104.
Knudsen Effusion Method
As a dynamic gravimetric technique, the Knudsen effusion method is based on the rate at which vapor molecules escape into vacuum through an orifice of known dimensions present in a Knudsen cell (Figure 1) at a known temperature.
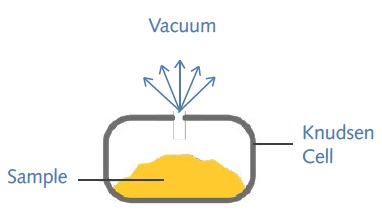
Figure 1. The Knudsen cell
The VPA system is equipped with the UltraBalance from Surface Measurement Systems Ltd to measure the rate of mass loss via the orifice. It is possible to analyze a sample mass range of 1-100mg at a temperature range of 20-40°C.
The typical analysis begins with placing the sample in a titanium Knudsen cell consisting of an orifice and heating it to experimental temperatures. The rate of mass loss and the vapor pressure of condensed phase (P) are related by the Knudsen equation as follows:
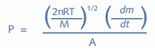
Where,
dm/dt = The rate of mass loss within the Knudsen cell with respect to time
M = The sample molar mass (mol/g)
R = The universal gas constant
T = Temperature and A = Area
dm/dt represents the slope value obtained from the experimental mass data fitted by the least square regression over a specific period of time (Figure 2). The vapor pressure can then be calculated by applying the dm/dt value in equation above.
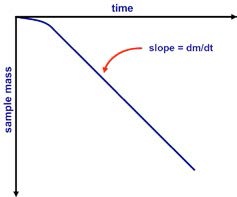
Figure 2. Mass versus time data from Knudsen cell
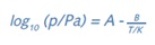
The equation below expresses the Clausius–Clapeyron equation, where the values of the constants A and B can be determined using a set of measured vapor pressures at various temperatures. This, in turn, allows calculating the enthalpy of vaporization (ÄH) or heat of sublimation.
VPA Analysis Software - DVS Vacuum Analysis
The following are the key features of the VPA analysis software:
- Knudsen vapor pressure analysis
- Windows®-based graphical interface
- Flexible data-range selection
- One-click data analysis and report generation
- Easy importing of results from various methods for simultaneous analysis
VPA Control Software - DVS Vacuum Control
The following are the key features of the VPA control software:
- Quick-set methods
- Incubator and pre-heater temperature control
- Real-time display of experiment progress
- Turbo pump control
- Easy saving and restoring of methods
- Balance tare and calibration wizards
- Data saved in a tab-separated values (TSV) file
- Windows®-based interface
Schematic and Key Components
The schematic of a VPA system is shown in Figure 3:
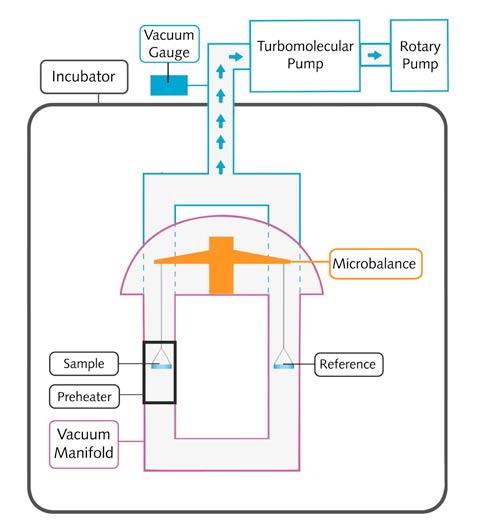
Figure 3. The schematic of a VPA system
Controlled and stable temperature environment with a temperature range of 20-70°C and stability of ±0.2°C can be obtained for experiments using the temperature- controlled incubators. The sample can be heated up 400°C with the help of the high-temperature local sample pre- heater.
The vacuum system involves a rotary pump capable of producing minimum vacuum pressure of 1 x10⁻³Torr. Lower vacuum pressure down to 1 x10⁻⁷Torr can be achieved when the rotary pump used in conjunction with the turbomolecular pump.
The vacuum transducer operates in the range between 900 and 1x10⁻⁸Torr, thus allowing measurement of ultimate vacuum pressure. Vacuum manifold is made principally of 316 stainless steel for chemical inertness, VCR sealed (Cu) fittings and KF flanges.
The ultra microbalance has a resolution of 0.1µg and peak-to-peak noise of = 0.7µg, enabling real-time sample mass measurement of up to 1.0g with a mass change of up to ±150mg at a high vacuum and given temperature.
Experimental Data
Figures 4 to 7 present the experimental data:
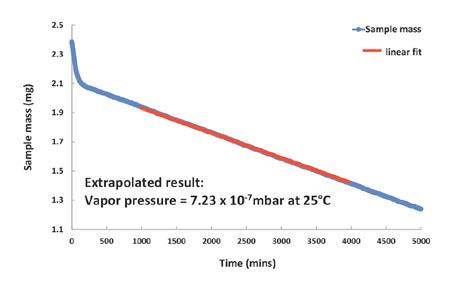
Figure 4. Vapor pressure of Bifenthrin is too low to be measured at 25°C, but can be extrapolated from the DVS Vacuum data recorded at 65°C.
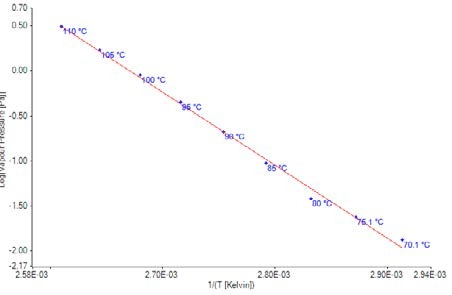
Figure 5. Plot of vapor pressure data for Bifenthrin
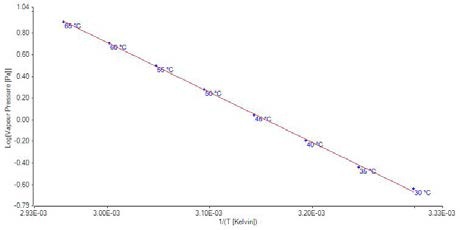
Figure 6. Plot of vapor pressure data for benzoic acid
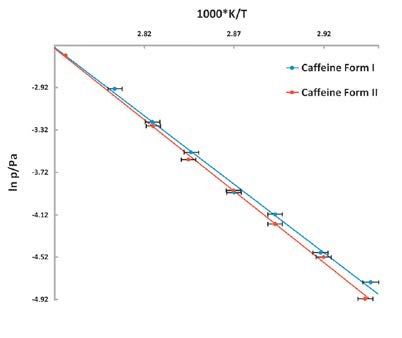
Figure 7. Vapor pressure of Caffeine vs temperature stability study. The lower vapor pressure of Form II shows it to be the more stable polymorph.