The United States does not have specific regulations detailing the permissible levels of toxic elements in foods, whereas many other countries do. For instance, Canada has a specific tolerance level for arsenic of 0.1 ppm in ready-to-serve fruit juices, nectars, and beverages.1
The toxic nature of arsenic is such that prolonged exposure to the elements can result in skin cancer, internal cancers of the bladder and kidney, neurological effects and cardiovascular disease.
Arsenic can make its way into the food chain via a diverse range of paths. Until recently, different organic arsenicals were employed for use as herbicides and antimicrobial agents in agricultural fields as well as directly applied on fruits and fruit trees.
Prior to 2003, arsenic was frequently used as a wood preservative. Sanding and/or sawing of treated wood would produce arsenic-contaminated sawdust.
In some areas, arsenic is found naturally in rock formations and can penetrate the soil and water supply used in the growth of food products. Contamination of foods can also occur during manufacturing, processing, packaging, and transport processes.
There are some distinct analytical challenges that an analyst must take into consideration when identifying arsenic in foods by GFAAS. Toxic elements, such as arsenic, which may be present at very low concentrations in foods are biologically important.
The U.S. Department of Health and Human Services, Agency for Toxic Substances and Disease Registry (ATSDR) establishes a minimal risk level for chronic inorganic arsenic exposure to be 0.0003 mg As/kg/day.
The minimal risk level for a 45 lb. child drinking a liter of fruit juice a day, would then be about 6 µg/L. Therefore, the analytical technique used for this application must have the capacity to precisely measure arsenic in sample digestates at the sub-ppb concentration level.
A complete method has been designed for the identification of arsenic (As) in baby foods and baby fruit juices by Graphite Furnace Atomic Absorption Spectroscopy (GFAAS).
This method involves sample preparation steps using microwave-assisted digestion in a closed vessel. Foods can be found in a variety of complex sample types and intricate matrices, but their basic major constituents are water and various carbohydrates.
In this work, the samples were completely digested in a microwave oven so that the various carbohydrate matrices of the samples were destroyed prior to instrumental analysis.
Microwave digestion has multiple analytical advantages for this kind of analysis. Since the sample is positioned in a sealed PTFE polymer digestion vessel, contamination is minimized and there is no loss of volatile elements throughout the digestion process.
Higher digestion temperatures are achieved in a sealed vessel, resulting in complete matrix decomposition.
With the microwave system used here, the digestion process of each sample is accurately documented in terms of time, pressure and temperature. This produces an analytically repeatable and transferable digestion process.
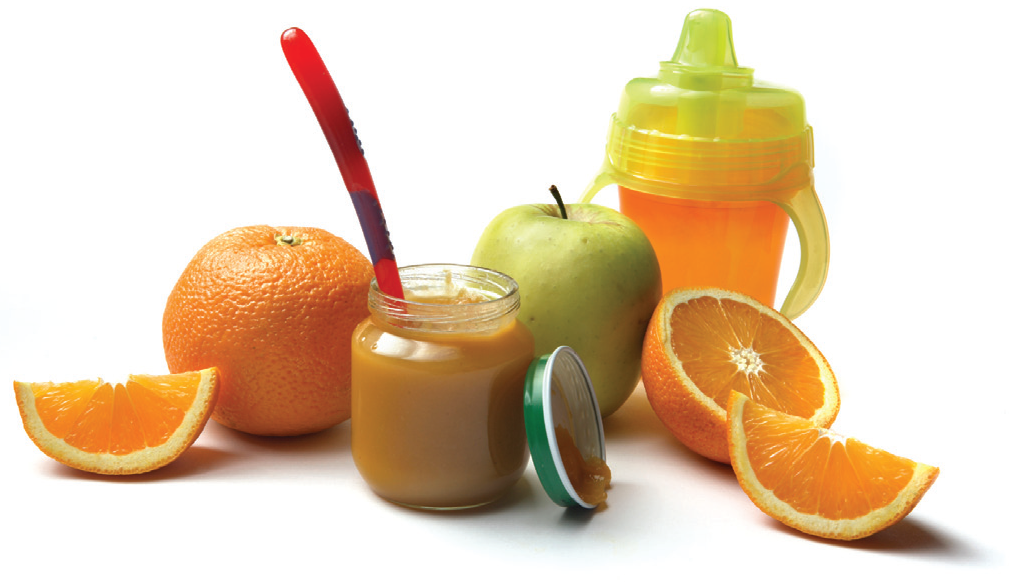
Figure 1. Examples of samples used in this work. Image Credit: PerkinElmer Food Safety and Quality
Experimental
A Multiwave™ 3000 Microwave Oven (PerkinElmer®, Shelton, CT USA) was utilized for the microwave-assisted digestion.
This is an industrial oven that can be fitted with various accessories to improve sample digestion. In this instance, the food was digested in the Rotor 8XF100, which is a rotor with 8 high-pressure vessels made of PTFE-TFM enclosed in a ceramic jacket.
TFM is chemically modified PTFE that has improved mechanical properties at high temperatures in contrast to traditional PTFE. This vessel has a “working” pressure of 60 bar (580 psi) and can function at temperatures up to 260 ˚C with an internal volume of 100 mL.
The temperature of all vessels’ were monitored using the IR Temperature Sensor Accessory.
This device offers thermal protection to the reactions in all of the vessels by remotely measuring the temperature on the floor of each vessel liner throughout the digestion process.
Pressure is monitored continuously in all vessels utilizing load-cell technology in the upper rotor plate.
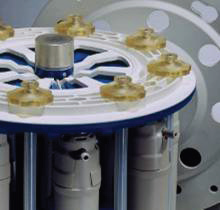
Figure 2. The Multiwave Rotor. Image Credit: PerkinElmer Food Safety and Quality
Samples of solid fruit purees and fruit juices were directly weighed into the PTFE-TFM digestion vessel liners (Figure 2). Sample weights were around 2 grams for the liquid juices and 1 gram for the fruit purees. A total of 6 mL of concentrated nitric acid and 0.5 mL of concentrated hydrochloric acid were added to each sample.
A spike of arsenic was added to some of the samples before digestion to measure the recovery of the analyte through digestion. Some vessels contained only the acids sans sample to serve as analytical reagent blanks. The vessels were sealed and placed in the rotor for microwave digestion.
The acids used demonstrated high purity GFS Chemical™ (Columbus, OH, USA), which are packed into PTFE containers. After digestion, the digestates were transferred to 50-mL polypropylene autosampler vials (PerkinElmer part number B0193234) and ASTM type I laboratory water was added to a total weight of 25 grams.
Table 1. Microwave Digestion Program. Source: PerkinElmer Food Safety and Quality
| Step |
Power
(Watts) |
Ramp
(min) |
Hold
(min) |
Fan
Speed |
| 1 |
750 |
10 |
10 |
1 |
| 2 |
1200 |
10 |
10 |
1 |
| 3 |
0 (cool-down) |
0 |
15 |
3 |
Table 1 exhibits the power/time program used for the sample digestions. To make sure digestion was safe, the Multiwave 3000’s IR sensor measures the temperature of each vessel.
When a vessel approaches its maximum operating temperature of 260 ˚C, the Multiwave oven will automatically decrease the applied power. The pressure sensor transmits data to the Multiwave oven controller throughout digestion.
The Multiwave oven will reduce power automatically if the maximum pressure of 60 bar is reached. An AAnalyst™ 800 Atomic Absorption Spectrometer (PerkinElmer) was utilized for the GFAAS measurements of arsenic in the samples digested.
The AAnalyst 800 has a longitudinal Zeeman-effect background correction2 and a solid-state detector which is very efficient at low wavelengths (the primary AA wavelength of arsenic is 193.7 nm).
The AAnalyst 800 uses a transversely heated graphite atomizer (THGA) that provides uniform temperature distribution along the entire length of the graphite tube. The THGA has an integrated L'vov platform3 which is useful for overcoming potential chemical interference effects common to GFAAS techniques.
A 10 µg/L As standard was prepared from serial dilutions of a 1000 mg/L stock standard (PE Pure, PerkinElmer Part Number N9300102) for instrument calibration. The AAnalyst 800 autosampler then produced a calibration curve of 2.5, 5.0 and 10.0 µg/L from that 10 µg/L arsenic standard.
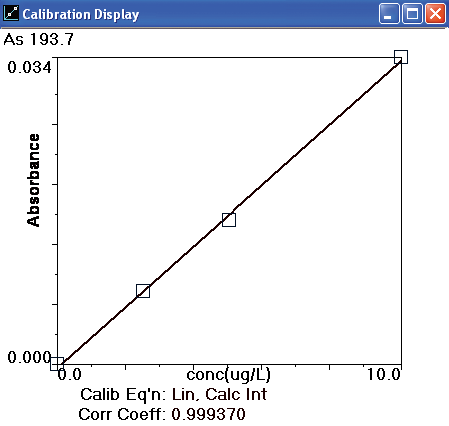
Figure 3. Arsenic calibration curve. Image Credit: PerkinElmer Food Safety and Quality
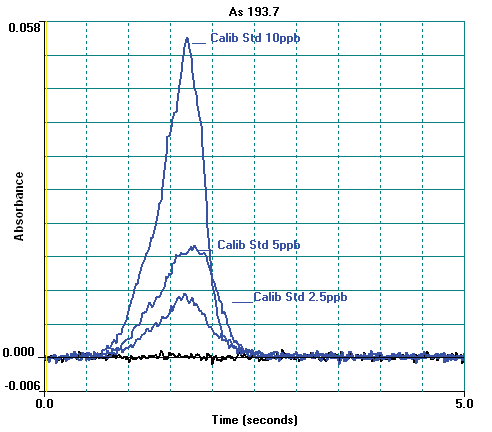
Figure 4. Arsenic atomic profile signals for calibration standards and blank. Image Credit: PerkinElmer Food Safety and Quality
A QC standard was also calculated using this method, High Purity Standards TM-A, (Charleston, SC 29423) and is proven to be 10 µg/L arsenic. Diluting and combining individual stock matrix modifier solutions produced a mixed matrix modifier of palladium and magnesium nitrate.
This mixed modifier solution is prepared by mixing 5 mL of the stock palladium modifier (1% solution, PerkinElmer Part Number B0190635) and 0.5 mL of the magnesium nitrate stock modifier (PerkinElmer Part Number B0190634) and diluting to 50 mL with ASTM Type I water.
Other instrumental parameters are provided in Tables 2 and 3. A standard calibration curve is exhibited in Figure 3 and calibration standard profiles are displayed in Figure 4. The curve demonstrates excellent linearity and at low concentrations the sensitivity is good.
Table 2. AAnalyst 800 Instrumental Parameters. Source: PerkinElmer Food Safety and Quality
| . |
. |
| Wavelength (nm) |
193.7 |
| Source Lamp (mA) |
EDL 380 |
| Slit Width (nm) |
0.7 |
| Background Correction |
Zeeman-effect |
| Measurement Mode |
Peak Area, 3 replicates |
| Calibration Algorithm |
Linear thru Zero |
| Integration Time |
5.0 |
| Sample Volume |
24 |
| Matrix Modifier Volume |
6 |
| THGA |
Standard THGA Tube |
Table 3. THGA Heating Program. Source: PerkinElmer Food Safety and Quality
Step
(˚C) |
Temperature
(sec) |
Ramp Time
(sec) |
Hold Time
(mL/min) |
Argon
Gas |
| 1* |
120 |
1 |
30 |
250 |
| 2 |
140 |
5 |
15 |
250 |
| 3 |
1100 |
10 |
15 |
250 |
| 4** |
1900 |
0 |
5 |
0 |
| 5 |
2450 |
1 |
3 |
250 |
* = Injection Temperature = 100 ˚C.
**= Atomization Step
Results
Fully digested, clear sample solutions were yielded using the Multiwave 3000 Digestion System with the rotor-8, and no filtration was needed.
The AAnalyst 800 produced a characteristic mass (Mo) of 36 pg for arsenic with these conditions, corresponding well with the Mo value of 40 pg as advised by the manufacturers. Nine different samples of baby juice and puree foods were assessed using this method.
The fruit juices and one of the puree samples were prepared in duplicate to check the entire method’s reproducibility. These samples were also “spiked” prior to digestion with the equivalent in the undiluted sample of approximately 240 ng/g arsenic.
The percent recovery of this spike will be used to check for any losses of arsenic during the digestion and to check for matrix interferences.
Table 4 exhibits the average of the three replicate measurements for the food sample corrected for weight used and final volume, the standard deviation of those measurements (SD), and the relative standard deviation of the three replicates (%RSD). The first seven samples revealed were digested in duplicate.
The difference between the two is exhibited in the column labeled % Diff.
The comparatively high percent differences in the pear puree samples is a result of the concentration of arsenic being extremely low in this sample, close to the method detection limit for the puree of 3 ng/g.
For samples that were split and spiked with arsenic before digestion, Table 4 shows the measure of the spike recovery as the percentage of the recovery in the final column.
A recovery value of near 100% demonstrates that there are no unresolved matrix interferences with the analytical method and that there is little or no loss of analyte during the digestion process.
Table 4. Results for the Analyses of Baby Foods by GFAAS. Source: PerkinElmer Food Safety and Quality
Sample ID
(ng/g) |
Mean
(ng/g) |
SD |
%RSD |
% DIFF
of Spike* |
%Recovery |
| B_Pear Juice |
10.2 |
1.2 |
12 |
9.9 |
93.9 |
| G_Pear Juice |
15.1 |
0.65 |
4.3 |
3.3 |
90.0 |
| B_Grape Juice |
27.4 |
2.2 |
8.2 |
0.70 |
85.0 |
| B_Apple Juice |
12.4 |
0.96 |
7.8 |
3.4 |
92.6 |
| G_Apple Juice |
18.2 |
0.29 |
1.6 |
4.7 |
|
| B_Cherry Juice |
10.3 |
0.77 |
7.5 |
23 |
|
| B_Pear Puree |
5.00 |
2.0 |
35 |
55 |
95.7 |
| G_Pear Puree |
<3 |
|
|
|
|
| B_Apple Sauce |
<3 |
|
|
|
|
| HP QC TM-A (μg/L) |
10.0 (μg/L) |
0.051 |
0.51 |
|
99.9 |
*Predigestion spike of 5 μg/L in the final solution or analysis
Conclusion
It has been established that this method can be applied successfully to the determination of arsenic in these types of foods. During the high temperature, high pressure process, the Multiwave 3000 Digestion System provided completely digested, clear samples with no loss of arsenic.
The AAnalyst 800 with longitudinal Zeeman-effect background correction and THGA tube, including the L’vov platform, provided excellent spike recoveries with no matrix interference.
The detection limit approximated at 3 ng/g was well within the Canadian limit of 100 ng/g in the original juice or puree and shows that there is room for lower regulatory limits that may be needed in the future to also be satisfactorily measured.
References
- Department of Justice Canada, https://laws.justice.gc.ca/eng/
- Hadgu, G. and Frech, W. Spectrochim Acta 49B, 445 (1994).
- L’vov, B.L., Spectrochim Acta, 45B, 633 (1990).

This information has been sourced, reviewed and adapted from materials provided by PerkinElmer Food Safety and Quality.
For more information on this source, please visit PerkinElmer Food Safety and Quality.