In recent years there has been an increased concern about the environmental and economic impact fossil fuel combustion and petrochemicals are having. This has led to a search for suitable and realistic alternatives with gasification emerging as a genuine option for the generation of fuel and hydrocarbons.
Image Credit: Shutterstock/ Hywit Dimyadi
The gasification method utilizes materials such as biomass, coal and waste to generate synthesis gas (syngas) . Syngas is a combustible combination of carbon monoxide hydrogen and carbon dioxide which contains a small amount of methane and certain trace contaminants. Syngas is primarily used as a fuel resource to produce power and heat, or transformed into products such as hydrogen, for use in fertilizer generation or fuel cells, or liquid fuels by means of the Fischer-Tropsch reaction.
The MAX300-IG
Chemical and gasification methods that use syngas depend upon the ability to acquire data about the gas stream composition leaving the reactor.
The MAX300-IG is a 7th generation process mass spectrometer capable of performing quantitative analysis on a number of compounds at concentrations in the range of 100% to 10ppb. The tool uses a 19mm quadrupole mass filter which enables high analytical repeatability and enhances prolonged stability.
The EERC Test Facility
The MAX300-IG was used to monitor syngas manufacture at a pilot facility of the Energy & Environmental Research Center at the University of North Dakota. It is possible to configure the tool using a fluid bed gasifier or an entrained flow gasifier, and then use it for analyzing pressure swing absorption, Fischer-Tropsch synthesis, hydrogen membrane separation and the effects of coal pretreatment.
Biomass or pulverized coal is supplied into the gasifier at temperatures exceeding 1000°C and pressures up to 70bar. The gasifier temperature, the flow of the solid fuel feed, and the flow of oxygen, steam, nitrogen and recycled syngas can be closely monitored and controlled.
Filtering of the gasifier product is done to eliminate particulates before transporting it into a series of fixed beds (Figure 1). Each bed is temperature controlled and can be loaded for catalyst/sorbent analysis or to modify the syngas.
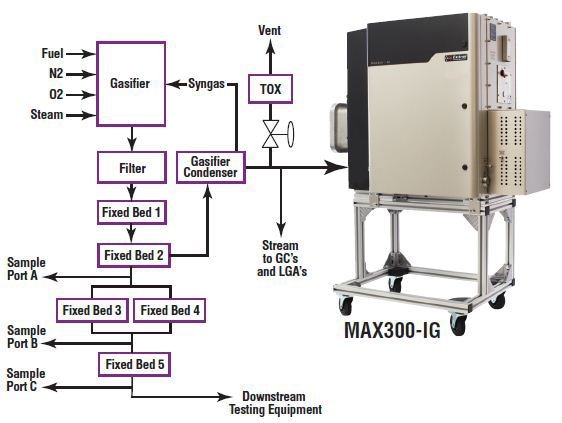
Figure 1. Pilot Gasifier and Syngas Conditioning System
Many of the ports in the system are constructed to allow gas sampling at every stage. The end product exiting the beds is then routed to examine other equipment or processes. Gasifier production is observed by a set of analyzers that are placed on a stream taken from the second fixed bed. This stream is sent via a quench condenser to eliminate moisture and volatile organics prior to being examined by many Raman laser analyzers and gas chromatographs.
The sampling process can be performed in an hour, and in that time, the concentration of each component (N2, O2, H2, CO, CO2, COS, CH4, H2O, H2S) is generally updated between one and three times every 15min.
MAX300-IG Analysis Results
An analysis technique was developed to identify the key components in the syngas stream along with common sulfur contaminants (Figure 2). All the components are measured and recorded in less than 0.4sec. The total analysis time for this technique is < 6sec.
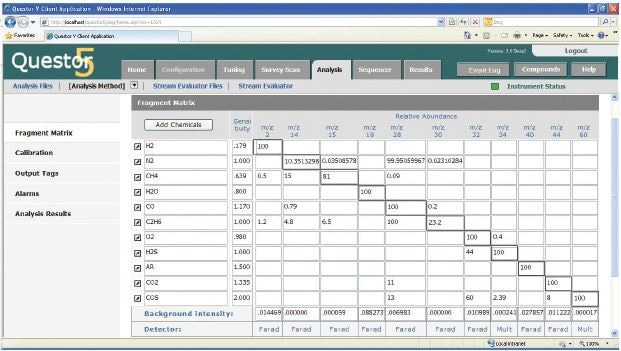
Figure 2. The MAX300-IG syngas analysis method containing the list of analytes, detection masses, and calibration values. This image is a screen capture of the Questor5 Software.
The syngas process was operated by a MAX300-IG located online to check the gasification of torrified wood pellets (Figure 3). The syngas composition differs, cycling about every 15min as an outcome of the programmed pulsing of the filter container.
These procedures affirm the ability of the MAX300-IG to identify swift changes in the sample stream. The outcomes for the study of a stable syngas combination show the analytical stability of the quantitative data of the MAX300-IG over 4h (Table 1).
Table 1. Average concentrations for the major syngas components recorded during a 4h MAX300-IG analysis run on a stable syngas mixture. Each concentration is the average of 1,790 analysis points.
| Component |
Average Concentration (%) |
Standard Deviation |
| Hydrogen |
30.35 |
0.016 |
| Carbon Monoxide |
29.57 |
0.022 |
| Carbon Dioxide |
19.99 |
0.012 |
| Nitrogen |
13.57 |
0.044 |
| Methane |
3.03 |
0.003 |
| Ethane |
0.51 |
0.002 |
Low level sulfur contaminants are also measured using the MAX300- IG with the aid of an electron multiplier, a part of the dual detector option (Figure 4). This option widens the range of detection in the mass spectrometer to 10ppb. The identification of sulfur concentration levels increasing can be a vital indicator of catalyst breakdown.
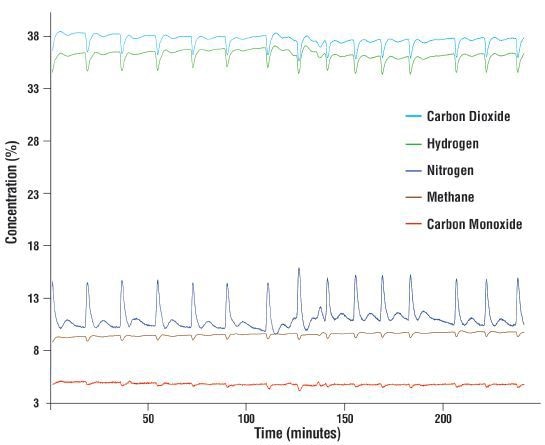
Figure 3. MAX300-IG analysis of the major syngas components. 3,225 samples were recorded over 4 hours of analysis.
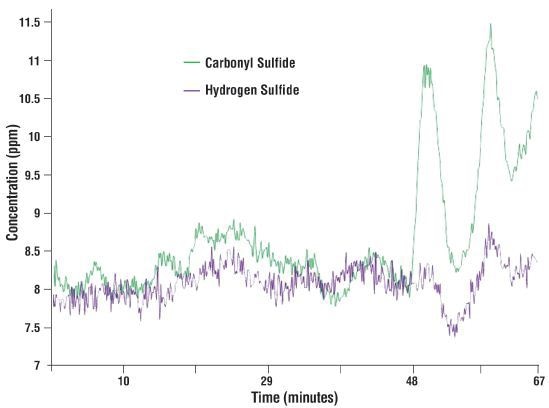
Figure 4. MAX300-IG detection of ppm-level sulfur compounds in syngas. 628 analysis cycles were recorded in the 1h 7min acquisition period.
Signal stability is very good even at ppm levels, which is shown by the standard deviation of analysis over a considerably uniform, section of the sulfur trend (Table 2).
Table 2. Average concentrations for the syngas sulfur components recorded on a MAX300-IG electron multiplier. Each concentration is the average of 188 analysis points recorded over 20min.
| Component |
Average Concentration (ppm) |
Standard Deviation |
| Hydrogen Sulfide |
7.9 |
0.15 |
| Carbonyl Sulfide |
8.1 |
0.20 |
Further Applications in Gasification
The MAX300-IG has proved its flexibility to rapidly describe and quantify syngas mixtures. It is sensitive enough to identify trace components at parts per million levels and below as well as the speed to execute all the measurements in under 0.4s. The mass spectrometer’s speed indicates that the MAX300-IG can be automated to observe gas composition at a number of sample points, thereby providing a whole set of concentrations at 20s per point.
At the EERC, supplementary sampling at the ports at the lower side of the reactor could yield significant insight into the functioning and efficiency of the fixed beds, or be used for studying hydrogen membrane separation, or a Fischer-Tropsch product.
At large units e.g., ammonia plants, where syngas is used, the MAX300-IG and its predecessors have established the standard for automatic analyzing and process control over the several decades (Figure 5).
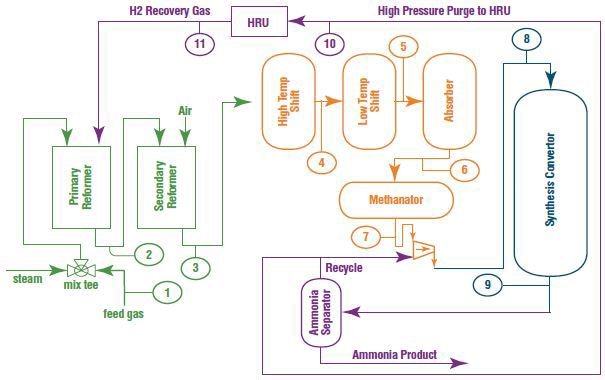
Figure 5. A diagram of the ammonia process. Typical analysis points for the process mass spectrometer are indicated at each of the numbered positions. The required syngas can be generated via natural gas reforming or gasification. Total analysis cycle time for 11 sample points is <4 minutes.
Conclusion
The MAX300-IG is an ideal tool with the capacity to evaluate a number of syngas components exiting the gasifier, from 100% down to ppm levels, thus the MAX300-IG can easily replace complex analysis instruments involving numerous devices and technologies. The speed and flexibility of the MAX300-IG along with its ability to operate round-the-clock in harsh and hazardous industrial conditions make it suitable for monitoring production scale gasification and other related chemical processes downstream.

This information has been sourced, reviewed and adapted from materials provided by Process Insights - Mass Spectrometry.
For more information on this source, please visit Process Insights – Mass Spectrometers.