Graphene has a large number of unique properties and can be challenging to work with.
Renishaw’s inVia confocal Raman microscope is an ideal tool for studying graphene, whether in the form of large films or small discrete flakes, and it delivers reliable and quick results easily.
Renishaw inVia Confocal Raman Microscope
The inVia is an extremely sensitive tool with high spatial and spectral resolutions, making it suitable for graphene measurements. The microscope can identify distinct spectral features and use these to differentiate graphene from other materials, including different forms of carbon. It can also identify and quantify strain, and detect damage and disorder in the graphene structure.
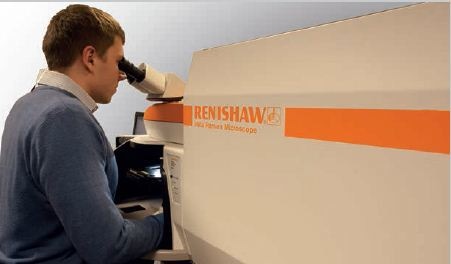
Figure 1. Renishaw inVia confocal Raman microscope
The tool can also be used to measure the thermal conductivity, doping levels and electrical properties of graphene, and can determine the number of graphene layers, as shown in Figures 2 and 3.
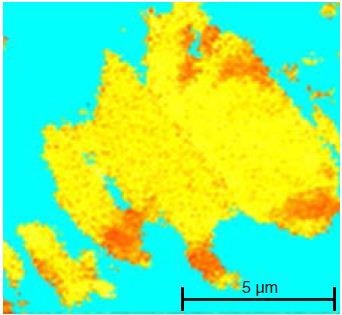
Figure 2. Raman image indicating the number of graphene layers - single, orange; double, yellow. Data was acquired in under 3 minutes
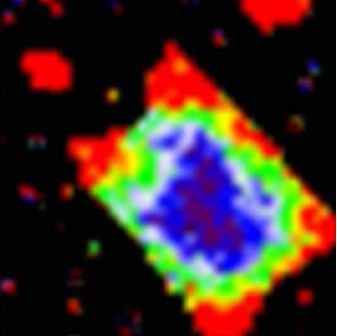
Figure 3. Raman image of a graphene flake showing the peak position of the G-band. Red regions correspond to compressive stress
Graphene Analysis Using inVia
Renishaw’s inVia can be integrated with scanning probe microscopes, such as atomic force microscopes, to analyse graphene at the nanoscale. This feature enables the inVia’s chemical analysis capabilities to be added to the property information and high spatial resolution topography acquired by SPMs/AFMs.
High sensitivity and rapid mapping techniques, such as StreamLine™, StreamLineHR™, and Slalom™, enable the rapid and easy analysis of large areas. Due to its high optical efficiency, low laser powers can be used, thereby preventing damage to the graphene samples during analysis. Figures 4 and 5 show an optical image compared with StreamLine Raman map data acquired by the inVia confocal Raman microscope within 2 minutes.
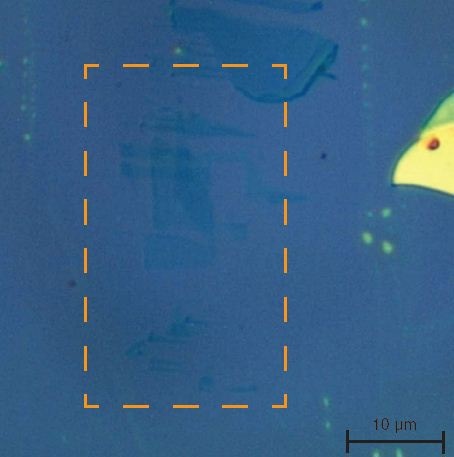
Figure 4. An optical microscope image of a silicon wafer coated with discrete graphene flakes. The only clearly visible features are the lighter areas to the right of the image. These contain multiple-layer graphene, which is of little interest to researchers. It is unclear from this image if graphene is located in the highlighted rectangular area.
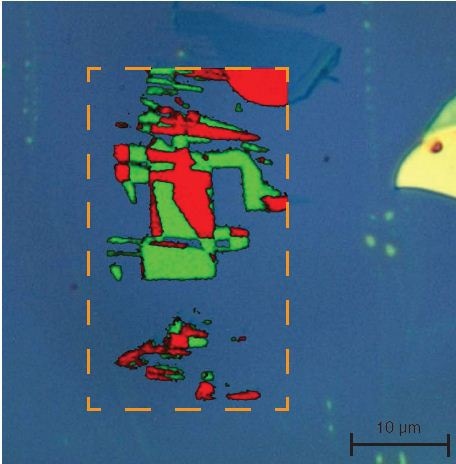
Figure 5. A Raman image of the highlighted area reveals that it contains single-layer (green) and bi-layer (red) graphene
Features of inVia
The key features of the inVia are:
- Measurements can be queued to ensure efficient instrument useage
- Flexibility to switch between high and standard confocal imaging
- Research grade Raman microscope
- StreamLine™ imaging technology ensures high speed mapping
- StreamLine imaging with Slalom™ provides a comprehensive overview of the samples
- High confocality StreamLineHR™ imaging scrutinizes small details
- Custom solutions can be developed to meet special requirements
Conclusion
Renishaw has developed Raman systems with vast research capabilities, and high optical efficiency and product quality.
With top levels of flexibility, reliability and sensitivity across a wide range of applications, the inVia can be tailored to different needs associated with graphene analysis.

This information has been sourced, reviewed and adapted from materials provided by Renishaw - Raman Spectroscopy.
For more information on this source, please visit Renishaw - Raman Spectroscopy.