Shutterstock | Trodler
Combine the power of Renishaw's inVia™ confocal Raman microscope with nanoindentation measurements and directly correlate tribological and mechanical properties with chemical information such as polymorphism, crystallinity, phase and stress/strain.
Raman spectroscopy is considered to be a powerful technique mostly used for studying the composition, strain, stress, uniformity and disorder of materials. However, it does not directly characterize physical, tribological and mechanical properties.
Renishaw and Hysitron have merged an inVia confocal Raman microscope with a TI 950 TriboIndenter, developing a system with the potential to directly correlate mechanical property measurements with comprehensive chemical analyzes, in situ.
Collect High Quality Correlated Data from Samples
- Nano-scale indentation, wear and scratch analysis
- Determine mechanical, local and tribological properties
- In situ SPM for surface topography imaging
- Raman spectroscopy for structural and chemical properties
One Combined System
Using Renishaw’s fiber optic technology, inVia can allow coupling to a variety of nanoindentation systems, such as the TI 950 TriboIndenter® offered by Hysitron. Such pairings lead to a combined instrument that provides majorly improved characterization capabilities.
For maximum efficiency, one can analyze the same location on the sample by indentation and Raman spectroscopy without the need for transferring and orienting samples between instruments. The nanoindenter and inVia can also be used separately and simultaneously, without compromising on individual performance.
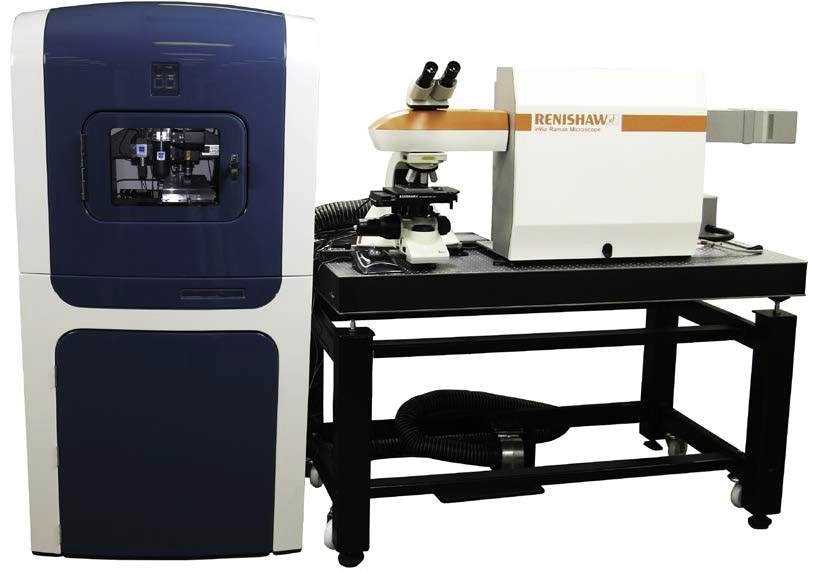
A TI 950 TriboIndenter (Hysitron, Minneapolis, Minnesota, USA) coupled to an inVia confocal Raman microscope via a separate fiber optic probe.
Gain Greater Insights into Mechanical Properties and Deformation Behavior at the Microscale and Nanoscale
Diamond-like carbon (DLC) is a class of metastable amorphous materials with a number of attractive mechanical, tribological, optical, chemical and electrical properties. These properties differ based on the relative abundance of sp3 versus sp2 bonding in their structures. DLC films can rival diamond based on mechanical performance, such as high wear resistance, extremely low coefficient of friction, high elastic modulus and high hardness.
The following study of diamond-like carbon films establishes the power of this combined Raman/indenter system.
Raman and Nanoindentation Studies of Three DLC Films
Three DLC films (a, b and c) were analyzed. All were deposited on silicon wafers by using varied deposition techniques. Raman point spectra were attained from each film, and then nanoindentations were made to produce indentation curves that reveal the modulus and the hardness of each film. The differences in the indentation curves of the three DLC coatings correlate with the variations observed in each Raman spectrum (Figures 1 and 2).
Sample c is the thinnest DLC film (40 nm), making this sample the softest of all three, since the indentation is sampling the softer silicon substrate and also the harder DLC film. This also develops the ‘elbow’ in the unloading portion of the indentation curve (Figure 2). The thinness of the coating of sample c is established by the existence of a silicon feature in the Raman spectrum; this is from the substrate, and appears since light can penetrate the thin DLC coating of sample c. This feature is not present in the other spectra due to the involvement of the much thicker coatings.
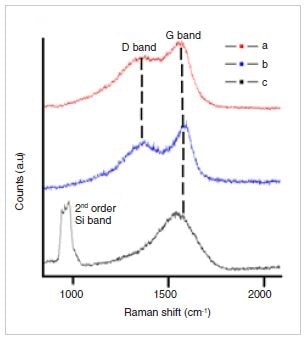
Figure 1. Raman spectra of DLC samples a, b and c.
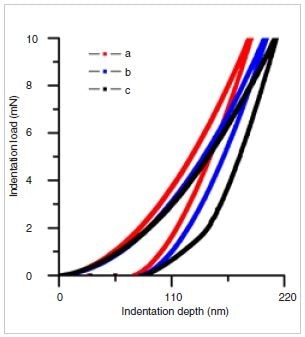
Figure 2. Indentation curves for samples a, b and c. A maximum normal force of 10 mN was used for each sample.
Raman and SPM Imaging of a Wear Pit
The behavior of the coating was examined further by carrying out a wear test on sample c (Figure 3). The wear pit was produced by traversing a Berkovich indenter five times over the surface at a 1 Hz rate, with a 500 μN normal force. The wear feature can be observed in the optical image (Figure 3A), in the scanning probe microscopy (SPM) image (Figure 3B), and in the Raman image (Figure 3C). Raman spectra are also presented for three key positions on the sample: inside the wear pit, at its edge, and on virgin material away from the pit.
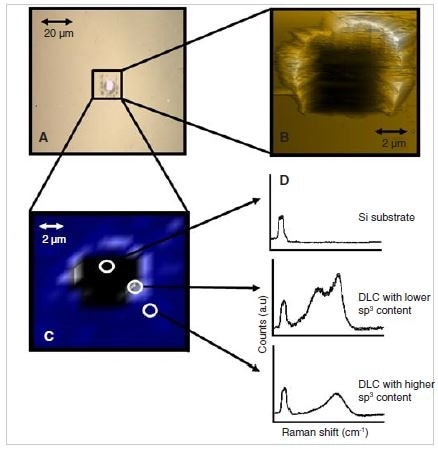
Figure 3. (A) Optical white light and (B) scanning probe microscopy (SPM) images of a wear pit on sample c. (C) In situ Raman image showing the distribution of the disordered (D band at 1360 cm-1) and graphitic (G band at 1580 cm-1) carbon band areas as well as the second order silicon band area at 960 cm-1. The color code is as follows: 1360 cm-1 D band (white), 1580 cm-1 G band (blue) and 960 cm-1 (black) second order silicon band. (D) Corresponding Raman spectra extracted from three different locations, as indicated on the Raman image.
The lighter appearance of the center of the optical image (A), and the height change in the SPM image (B), indicate that the film has been removed and that the silicon substrate exposed in the pit. The Raman spectrum (D) approves this, as it displays features from silicon, but not carbon.
Debris is seen at the edges of the pit, with a equivalent increase in height shown in the SPM image. Comparison of the Raman spectra from the edge of the pit and virgin material reveals the presence of an additional peak in the debris spectrum, linked with disordered carbon. This specifies that wear has moved coating material to the edge of the wear pit, and that deformation has changed it from an sp3 dominated structure to a more defective graphitic sp2 structure.
Experimental Conditions
Hysitron’s TI 950 TriboIndenter and Renishaw’s inVia confocal Raman microscope are coupled with the help of Renishaw fiber optic probes. These are mounted directly on Hysitron’s granite bridge, in order to attain stability. Using this configuration, one can acquire from the sample: an SPM image; Raman point spectra; Raman images; an optical white light image; and nano- and micro-indentation data, all without the need for transferring the sample between instruments.
Raman spectroscopy: The Raman measurements were produced with 514 nm excitation (Ar+ ion laser), with a 50× ultra-long working distance objective lens. Raman point spectra were attained on each DLC film. The wear pit image was produced by point mapping.
Nanoindentation: Indentation was carried out in continuous measurement regime (CMX) at maximum indentation load of 10 mN. This produced the depth profiles of indentation hardness and storage modulus of the DLC films. For the wear pit, the 40 nm DLC film on sample c went through nanoWear™ testing at a constant normal force of 500 μN. The Berkovich probe passed five times over the surface at a reciprocating rate of 1 Hz. The 6 μm × 6 μm topographic image was post-scanned in situ using scanning probe microscope (SPM) mode.
Conclusions
These studies demonstrate that Raman spectroscopy and indentation provide complementary chemical and mechanical information that can be used by engineers and scientists in order to improve their understanding of diamond-like carbon films. With the combined Renishaw/Hysitron instrument it is possible to make measurements in situ, at the same location, thus studying the spatial variation in coating properties, and also variations linked with microscopic features such as wear pits. The combined instrument also enables saving time by removing the necessity for transferring and orienting samples between instruments.
inVia. The Perfect Raman-Indentation Analysis Tool
- Combine inVia with nanoindentation measurements
- Nano-scale indentation, wear and scratch analysis
- Determine local, mechanical and tribological properties
- In situ SPM for surface topography imaging
- Raman spectroscopy for structural and chemical properties
Laser Safety
Class 3B laser product. Avoid exposure to beam. Invisible and visible laser radiation.
The Renishaw inVia confocal Raman microscope.
Acknowledgements
Renishaw would like to thank Prof. Virginia Lea Ferguson for hosting their team at University of Colorado, Boulder, and giving them time on her instrument.
Sample courtesy of Prof. Yeau-Ren Jeng and Dr Mehdi Rouhani, NCCU Taiwan

This information has been sourced, reviewed and adapted from materials provided by Renishaw plc.
For more information on this source, please visit Renishaw plc.