Raman spectra tend to have thermal backgrounds or fluorescence, and these characteristics can adversely affect matching when performing spectral library searches. They may also lead to a degradation in accuracy when determining components as part of quantitative analysis.
The WiRE™ (Windows®-based Raman environment) software from Renishaw features a patented Intelligent Fitting baseline subtraction tool that can be used to automatically and accurately eliminate unwanted backgrounds from spectra.
Using Intelligent Fitting offers accurate, consistent results because there is no longer any need for manual baseline removal, which is often subjective and time-consuming.
Using Intelligent Fitting, it is possible to remove both simple and complex baselines from a single spectrum. This can also be done automatically from many spectra in a Raman map.
Overall, Intelligent Fitting allows users to:
- Make Raman data easier to understand
- View minor changes between spectra
- Generate chemical images with increased accuracy
- Improve the accuracy of quantitative analyses
Single Spectra
Renishaw’s patented Intelligent Fitting baseline subtraction algorithm enables the rapid, automatic removal of baselines (Figure 1). Following background removal, both sharp and broad Raman bands will retain their shapes and features and minor details in the spectrum become far more clear. Ultimately, this makes the resulting spectrum easier to interpret.
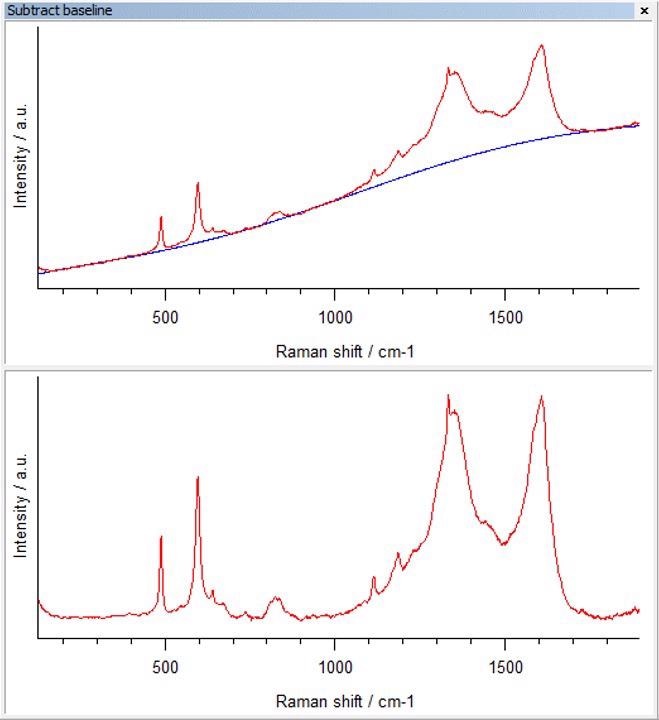
Figure 1. An example of Intelligent Fitting baseline removal from a Raman map average spectrum (top - original spectrum with baseline shown in blue, bottom - baseline removed result). Image Credit: Renishaw plc - Spectroscopy
Raman Map Data
Figure 2 shows the application of Intelligent Fitting to Raman map data from a thin film material that has been embedded in epoxy resin.
Here, qualitative analysis with no baseline subtraction (Figure 2A) is severely influenced by the fluorescence background, resulting in poor chemical specificity for the epoxy resin (orange) and carbon (green).
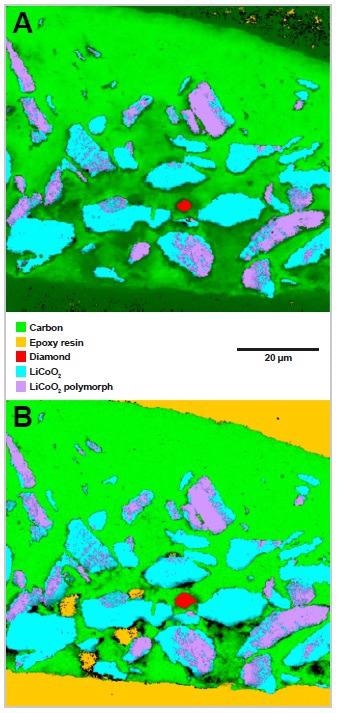
Figure 2. Example of component analysis, with and without prior Intelligent Fitting baseline removal. In A (data analysed without baseline removal) the epoxy resin component distribution is misrepresented. In B (data analysed with baseline removal) the epoxy resin component distribution is accurate. Image Credit: Renishaw plc - Spectroscopy
Results like these can be misleading, potentially providing incorrect information on the spatial distribution of these chemical components.
Figure 2B displays the results of component analysis after the automatic application of baseline subtraction. This was optimized for each spectrum. The figure confirms that subtraction has eliminated the fluorescent backgrounds, with the image now accurately illustrating the spatial distribution of every component present in the sample.
The epoxy component (orange) is now displayed correctly, whereas the previous example shown in Figure 2A saw this incorrectly interpreted as a low carbon concentration.
As well as providing chemical images that are more representative, Intelligent Fitting is also essential in quantitative concentration analysis because any background variation will affect concentration calculations considerably.

This information has been sourced, reviewed and adapted from materials provided by Renishaw plc - Spectroscopy.
For more information on this source, please visit Renishaw plc - Spectroscopy.