Renishaw’s set of rapid data collection options is able to generate data comprising thousands or even millions of spectra in seconds or minutes. It is important to target the most appropriate spectra for data processing and analysis in order to get the most out of a dataset.
Renishaw’s WiRE (Windows®-based Raman Environment) software includes a series of data masking options, providing users with versatile methods for the analysis of Raman map data.
WiRE’s masking options make it possible to exclude irrelevant spectra from both processing and analysis while keeping these spectra saved in the datafile so that they are available for further analyses if required.
Masks are suitable for use individually or in combination, meaning they offer a powerful approach to a wide range of circumstances, such as:
- Eliminating saturated spectra or spectra that are dominated by fluorescence from the analysis. Because these spectra include either no or minimal Raman features, disregarding them allows for improved accuracy of quantitative and qualitative results.
- Excluding regions that are sample holder, substrate, or surrounding area allows better focus on the region of interest, eliminating irrelevant chemical entities and simplifying analysis.
- When an average spectrum from all the regions that have been identified is produced as a particular component, this results in a spectrum possessing a high signal-to-noise ratio, ideal for the accurate review and identification of the material.
In each of these instances, masking allows users to gain more accurate quantitative and qualitative information from the data available.
Removing Unwanted Regions
Samples are rarely basic rectangular shapes, meaning that Raman images generated from map data are prone to including a number of regions that are of no interest. The scanned area is generally greater than the region of analysis or a different shape altogether.
Investigation of these types of samples requires a more targeted approach. Renishaw’s WiRE software offers a number of mask functions that are ideal for targeting specific Raman data for processing and analysis. Available masks include:
- Predefined and custom geometric shapes
- Masks defined from existing images of the sample; for example, Raman or white-light microscope images
- Masks based on images from other microscope systems - Renishaw’s Correlate software features also allow importing images from other such systems, including scanning electron microscopes.
- Masks that specifically exclude points with spectral anomalies; for example, saturated spectra
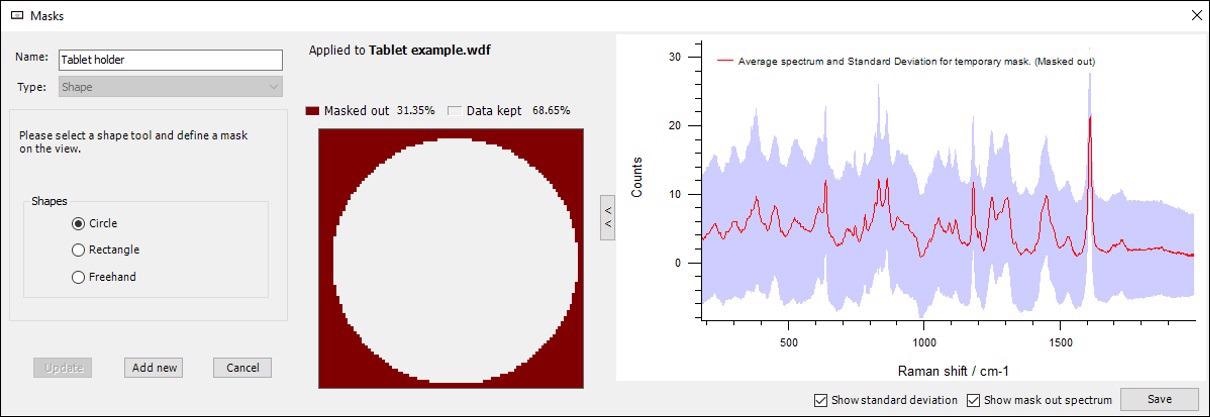
Figure 1. Excluding the region around a circular pharmaceutical tablet. The excluded region is highlighted in red (left). The average spectrum from the unmasked region, and its standard deviation, are also shown (right). Without this masking the average spectrum would be tainted by components from the red region. Image Credit: Renishaw plc - Spectroscopy
Combining Shape and Spectral Masks
It is also possible to combine shape masks with spectral data masks in order to eliminate unwanted components from the analysis (Figure 2).
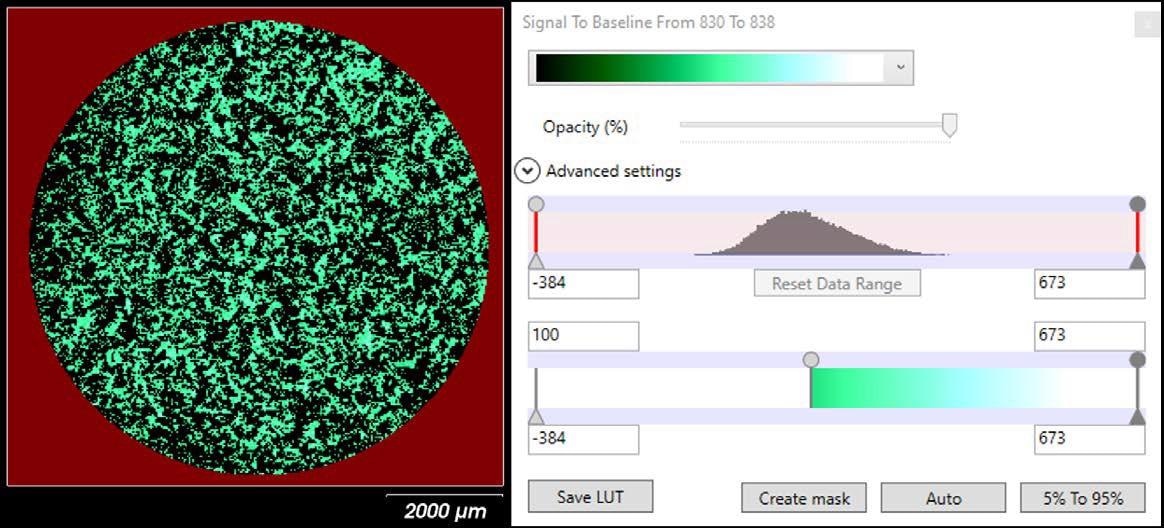
Figure 2. A Raman image of the tablet in Figure 1, showing a component based on the area of its Raman band at 834 cm-1. The masked-out geometric area around the tablet is shown in red (left). The look-up-table controls (right) show how the spectral masking is being configured to highlight the component and exclude other regions of the tablet (green and black in the left image, respectively). Image Credit: Renishaw plc - Spectroscopy
In this example, a shape mask (red) was used to remove the region around the pharmaceutical tablet. Performing spectral analysis on the unmasked region (tablet only) highlighted regions where a specific component is present (green) and excludes all the black regions.
The resulting average spectrum (Figure 3) is much clearer than the original (Figure 1) while featuring lower standard deviation. This approach is therefore ideal for users looking to identify material by eye or with a spectral database.
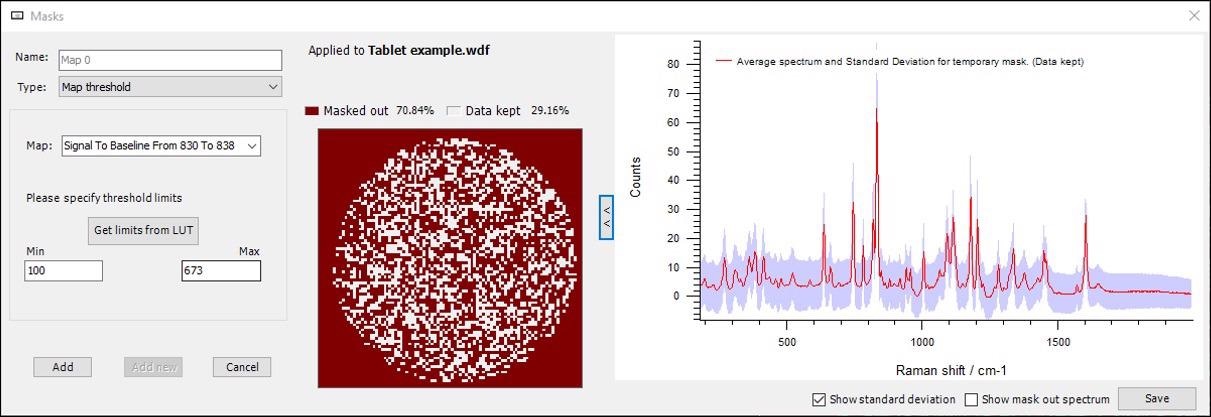
Figure 3. Combined shape mask with a spectral threshold mask (from Figure 2). The only regions being analysed are shown in white, with the red regions being masked. The resulting average spectrum from the white regions is sharp and has a low standard deviation. Image Credit: Renishaw plc - Spectroscopy
Flexibility
Every mask used throughout the analysis of a sample may be selectively activated and deactivated. Not only does this afford users enhanced flexibility, but it also allows them to rapidly understand every aspect of a sample

This information has been sourced, reviewed and adapted from materials provided by Renishaw plc - Spectroscopy.
For more information on this source, please visit Renishaw plc - Spectroscopy.