In this interview with Maarten Wirix, Thermo Fisher Scientific looks at some of the key benefits of automation - not just in terms of making tasks quicker or easier, but in terms of the other quantifiable benefits it can bring to any busy materials characterization lab.
Discover a range of practical examples showcasing how automation can increase overall productivity, either by increasing the number of samples run in a day or, more importantly, increasing the day-to-day data density collected with the instruments and improving the overall statistical relevance of results.
Automation can play a critical role in optimizing the overall utilization of the instruments in a lab while continuing to offer productivity, accessibility, and confidence to reliably accommodate complex, shifting analysis requirements.
What are some of the general benefits of automation?
One of the most significant benefits of automation is how it changes the overall accessibility of instruments. This may involve providing remote access to the instruments, using procedures and recipes that simplify complicated multi-step experimental techniques, or allowing less experienced operators to complete high-level tasks in a consistent, instrument-safe manner.
One of the hidden benefits of automation is improving overall confidence in the results. Automation helps solve issues related to a consistent experimental procedure, which ultimately drives the precision of results. This is particularly true where complex experiments need to be repeated across a range of samples or over a long period.
Looking at particle analysis more specifically, what are some of the more common techniques and instruments in use in this field?
There are many different techniques we can use for particle analysis. The most common example is transmission electron microscopy (TEM), which allows us to see the particles directly. Other techniques include centrifugal liquid sedimentation (CLS), single particle-inductively coupled plasma-mass spectrometry (ICPMS) and dynamic light scattering.
Other than electron microscopy, these techniques only provide average particle size information without directly visualizing the particles. This has certain advantages; for example, they are quick and cheap.
However, a key disadvantage of not seeing the particles directly is that we have no visual evidence of what we are characterizing. If the particles are aggregated, they may be handled as one single particle instead of an aggregate of multiple particles.
TEM has been identified as a recommended technique for identifying nanomaterials for that key reason. It has a high measurement accuracy in terms of size and shape. We can also determine size distribution and deal with aggregates of smaller particles.
TEM can be used to characterize sizes down to one angstrom to measure tiny particles. Suppose we want to measure size and composition. In that case, we could use, for example, the Thermo Scientific high-end Spectra family for the highest resolution results or the Talos family, which is a mid-range high throughput instrument designed to measure a lot of samples fast.
There is a distinct advantage to leveraging powerful automated methods to measure not only particle size and shape but also composition. Combining this information ensures much more confidence in a result.
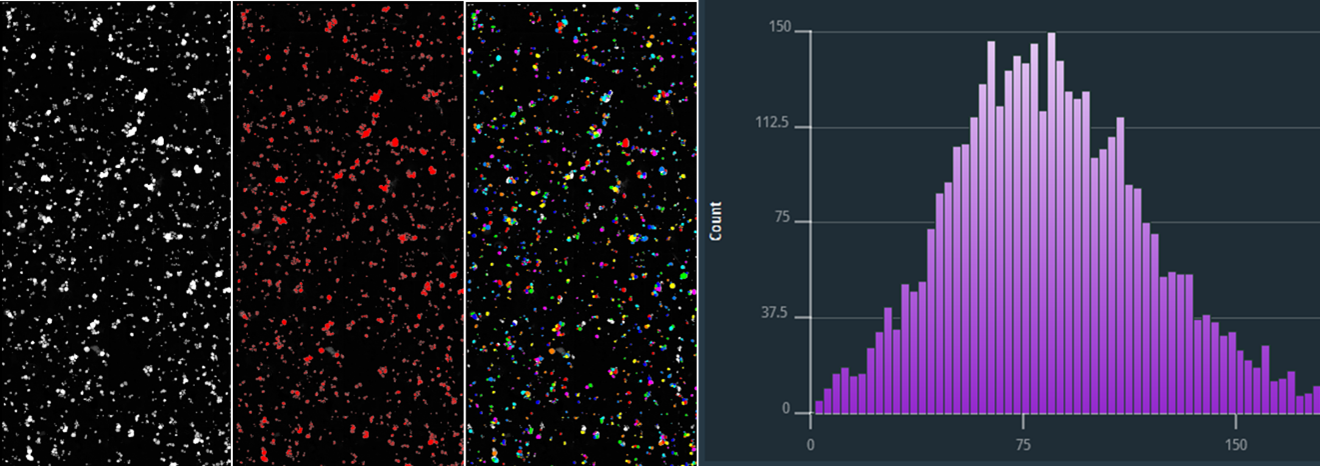
Figure 1: E171 TiO2 food additive analyzed with Automated Particle WorkflowTM. From left to right stem image, edx maps, segmentation and analysis result of a large sample region is shown. Original image resolution is 20kx20k.
What are some of the more commonly encountered challenges in particle analysis labs, and how can these be addressed?
Some of the more common particle analysis challenges for industrial R&D or academic labs are related to efforts to bridge the gap from atomic structure to physical property.
If we look at a single nano-scale microscopy image, this can rarely explain the sample’s physical properties, which are determined by a larger area of the sample. Therefore, it is beneficial to map larger areas and draw conclusions based on a statistical analysis of larger areas.
This approach can be applied to include catalyst nanoparticles, metal precipitates, and food additives.
Thermo ScientificTM Automated Particle Workflow (APW) solution uses this approach as the standard for any application where the user is interested in particle size and composition. APW enables users to acquire size and compositional data in a systematic fashion. This dataset is statistically relevant and can be automatically analyzed to include nanometer-scale size and chemistry information on large areas. This information is key to improving materials.
In a lot of labs, TEM analysis is still a manual process, which requires TEM users to repeat a slow and tedious process to get a statistically meaningful dataset.
Could you elaborate on how APW aims to address the issues mentioned?
APW aims to solve this problem from a number of different perspectives. First, there are its automated acquisition capabilities. The VeloxTM software allows users to collect TEM, STEM and EDX data.
This data is sent to the MAPSTM software, stored and displayed as images. MAPS can send this data via bridge to an Avizo2DTM processing computer, where Avizo2D will run a segmentation routine on the fly as soon as the images come in, sending back analysis data to the microscope computer where the data can then be displayed.
At the same time, Avizo2D writes the analysis data as a CSV file on the Avizo2D computer, allowing the data to be imported into a spreadsheet to be exported as graphs or histograms or for further processing. The CSV file can also be reimported in Avizo2D to make histograms and tables in Avizo2D.
APW users can get much better statistics faster - more than 500 particles per hour, instead of say 50 in total from manual analysis.
Significantly improved repeatability is enabled using a fixed, certifiable recipe with no operator bias.
Because the workflow is automated, it becomes possible to run a TEM unattended 24/7. Even out of hours when the microscope would usually be idle, users can program a particle size analysis task, and APW will execute, report the results and they can be picked up the following day.
APW can be used for any task where particle size analysis on the nanometer scale is needed because processing recipes in Avizo2D are entirely flexible in terms of segmentation strategies and measure groups and can be tailored to specific material problems.
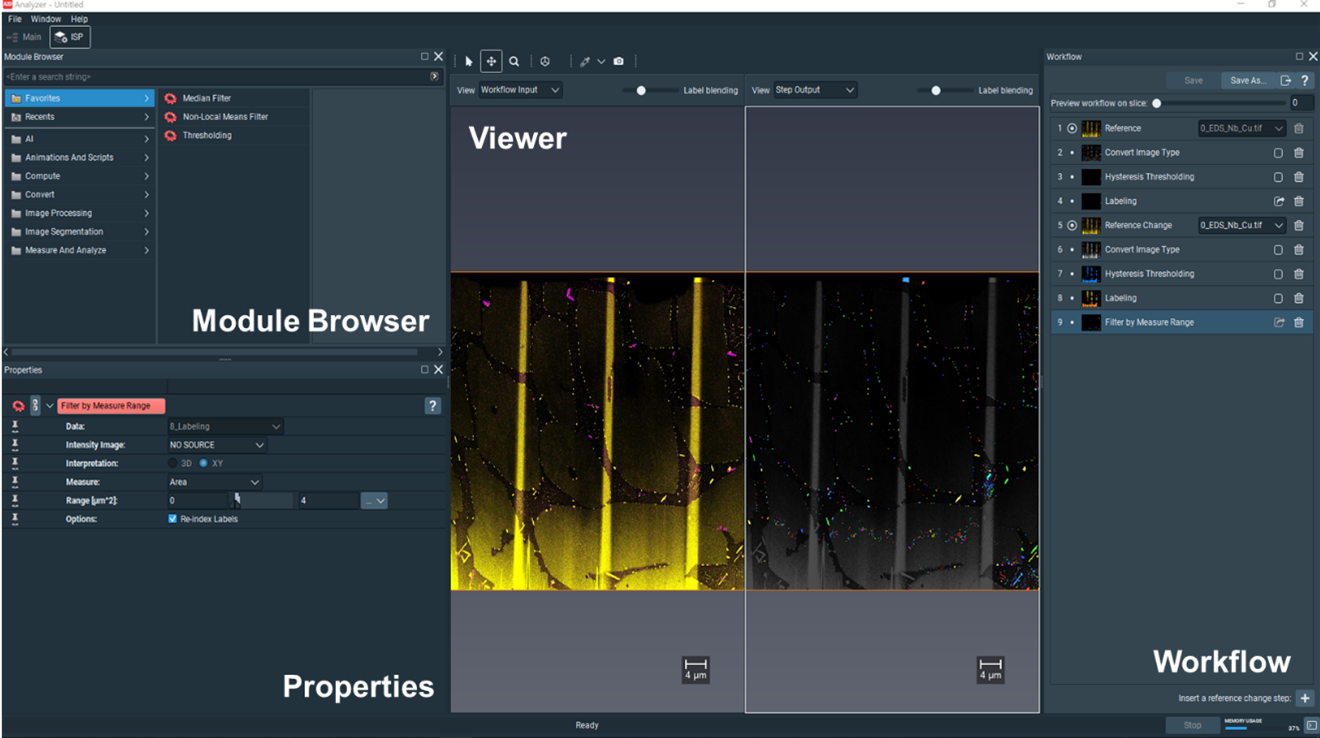
Figure 2: Multi-grain boundary segregation of Cu and Nb in surgical grade steel segmented shown in the recipe editor of Avizo2D. With Avizo2D users can create customized workflows for a wide variety of analysis tasks.
Are there any notable example applications of APW in a TEM workflow?
Yes. When recently working with platinum-iridium catalyst nanoparticles, we analyzed a raw TEM image, segmented particles, and generated a histogram, which shows the particle size distribution.
When working with multi-grain boundary segregation of Cu/Nb in surgical-grade steel, we highlighted another benefit of correlating imaging and EDX. There were two elements present in this case – Cu and Nb – and we wanted to independently report the Cu particle size and the Nb particle size. This was only possible thanks to APW. While testing APW for our customers, Thermo Fisher Scientific was able to generate separate particle size distributions of both elements.
In another example, we analyzed a TiO2 food additive known as E171, assembling and mapping a raw image from a very large area and creating edX maps of the titanium, allowing us to analyze every particle to confirm whether it is titanium or not. We then ran a segmentation routine on the combined image and EDX data, allowing us to report on the particle size distribution in histogram form.
The food additive E171 is a titanium dioxide powder that has been used in toothpaste, cosmetic paint and food additives over the last 60 years. Recently we have become more aware of the importance of characterizing nanomaterials. While in the 1960s, this material was approved for use as a food additive, now 50 years later, with growing awareness of possible health risks of nanomaterials, nanomaterial producers and food safety laboratories routinely have to characterize nanoparticles inside the food. Several countries have banned titanium dioxide as a food additive to protect consumers.
Using the example of E171, could you give our readers a brief overview of a typical APW workflow?
In the example mentioned, we captured a single nm scale image of the E171 powder dispersed on a carbon-coated TEM grid. This was done by mapping it with scanning transmission electron microscopy in combination with energy-dispersive X-ray spectroscopy (STEM-EDX).
Applying APW to this sample starts with a click, prompting MAPS to start an automated routine. Velox, in this case, collects STEM and EDX data sets. In the EDX maps, different elements are shown to the user in color. The image and spectroscopy data is sent to Avizo2D. The image and spectroscopy data are sent to Avizo2D where a segmentation routine is run, measurements are taken, and this newly segmented data is sent back to MAPS, displayed in the form of a colored overlay.
In MAPS, users can switch between the elemental display, which will show every element in a different color, or the analysis overlay, which provides a specific type of segmentation that we use to measure particle sizes.
Avizo2D will also display a table of numbers representing the measurement of the particle sizes. For example, equivalent diameter, area, etc. All the measurements from the user-defined measurement group are automatically exported to a CSV file. This data format can be easily imported into a spreadsheet or numerical analysis programs.
The advantage of doing this analysis tile-by-tile is that we can scale it up indefinitely. If we make one huge image, that image will become millions and millions of pixels, making the data size so big it would be impossible to analyze.
With APW, users define the areas they want to analyze. After the images are taken and sent to Avizo2D for tile-by-tile analysis, a single report per tile or one report for all the combined tiles is generated. Users can choose to do either only imaging or to combine imaging and spectroscopy and make a correlative analysis between their images and EDX maps.
In the example of the E171 sample, a grid of five-by-five tiles (25 tiles in total) was mapped and measured. Even in this relatively small area, we counted more than 4,000 particles. The median particle size here was 87 nanometers.
How customizable is the APW workflow and analysis process?
It is important to remember that APW is not just a black box. Our software packages certainly do not aim to compromise user understanding or education of the processes involved.
For example, the Velox software features indicator panels that show the real-time status of the different detectors and cameras while the data is being acquired. This allows users to track the process and see exactly how it works.
In the Avizo2D software, users can build custom recipes featuring as little or as many steps as they want, and the software also includes a wide range of filter segmentation and analysis tools, as well as detailed experiment trees, which allow users to create visual, easy to understand workflows.
Clicking on certain modules in Avizo2D allows users to access very advanced parameters under the hood, empowering them to solve highly complex particle analysis problems.
Lastly, in MAPS, we provide a visual display of all analyses undertaken. This is important because users would want to overlay the segmentation with the original data to verify their results. This manual confirmation is an important verification step when developing new analysis routines.
In short, the automated APW solution helps you be more productive because you can run your TEM 24/7 unattended, greatly improving productivity.
How does APW benefit TEM users?
As the whole workflow is automated, repeated experiments, which are very tedious to do manually, become an easy task. As a result, users can confidently obtain statistically relevant data fast and with less operator bias.
About Maarten Wirix
Maarten Wirix received his M.Sc. degree in Chemistry at KU Leuven University in 2009, Belgium. He worked on characterizing the second order optical properties of conjugated polymers. In 2014, he obtained his PhD in the Chemical Engineering and Chemistry Department at Eindhoven University of Technology, the Netherlands, where worked on the structural characterization dispersions containing building blocks of polymer solar cells with cryo- transmission electron microscopy (TEM). In 2014, he did a one-year postdoc at Eindhoven University of Technology on Cryo-TEM and liquid phase TEM. From 2015 to 2020 he was application scientist for TEM at FEI Company and later Thermo Fisher Scientific at the European Nanoport in Eindhoven. Since 2021 he is product marketing manager for high end TEM at Thermo Fisher Scientific.
About Thermo Fisher Scientific
Thermo Fisher Scientific is the world leader in serving science. Through our Thermo Scientific™ brand, we provide innovative solutions for electron microscopy and microanalysis. We offer SEMs, TEMs and DualBeam™ FIB/SEMs in combination with software suites to take customers from questions to actionable data by combining high-resolution imaging with physical, elemental, chemical and electrical analysis across scales and modes - through the broadest sample types.
Disclaimer: The views expressed here are those of the interviewee and do not necessarily represent the views of AZoM.com Limited (T/A) AZoNetwork, the owner and operator of this website. This disclaimer forms part of the Terms and Conditions of use of this website.