Increasingly, we witness technologies appear and, almost as quickly, be relegated to history in this ever-progressing age of technological advancement. Given the pace of these technological advancements, many contend the notion of print is endangered. Indeed, our daily lives seem to be permeated by internet access on a myriad of devices, offering access to literature that only a decade before would have been in print.
Understandably, many are questioning for just how long the printed word will last – and along with it, even the use of pen and paper. Nonetheless, writing persists in most homes and offices around the world – and certainly, the authority of a personal signature seems to stick around.
Validating the authenticity of written works is therefore important, particularly within the realm of legal documentation – agreements and contracts. The convention for approving legal documents remains a handwritten signature on paper, despite the growth of e-documents.
So, in document validation how can it be ensured that a signature is original? Of course, handwritten or signed documents do not have modes of tracking alterations, unlike electronic documents. Could a mortgage agreement be altered or a check changed by someone else?
This is why it is essential that the authenticity of writing can be ascertained. One of the leading solutions to this challenge is the inVia™ confocal Raman microscope, from Renishaw.
Analysis of Crossing Inks
In order to establish if a document contains changes made with different pens, a technique is required to differentiate between inks of similar color based on their chemical composition. The use of Raman analysis facilitates non-destructive, rapid testing of the inked areas in question, along with the ability to distinguish similar ink types that may look identical to the eye.
Renishaw has been using Raman imaging to determine the crossing order of two ink lines that may originate from different pens against a background of paper. So, how does the inVia reliably determine the origin of additional ink lines on paper?
The order in which the inks were deposited was determined through the implementation of several techniques that are unique to Renishaw. The method works by analysing the coverage of each ink within the region where they cross. A mixture of both ink components comprises the crossing region: logically, when analyzing using a laser impinging on the top surface, the uppermost ink appears in the largest quantity. False color images and concentration estimation techniques are used to reveal this.
Technique
The beginning of the process sees a white light image captured of the crossing region and surrounding area. The area is scanned using StreamLine™ chemical imaging in order to capture the composition of the crossing region. This uses a continually-moving line-focused laser to collect spectral information from the inks. A greater laser power can be used without damaging the ink, thanks to the line focus, which has a lower power density than a traditional spot focus.
Clear and distinct regions of the image are masked once the data is collected and pure references for each ink are obtained. Available as part of Renishaw's WiRE software, the Masking Tool is used to limit the data to be processed which can be defined by the thresholding of an image (for instance, white light or Raman) or by manual selection of an area.
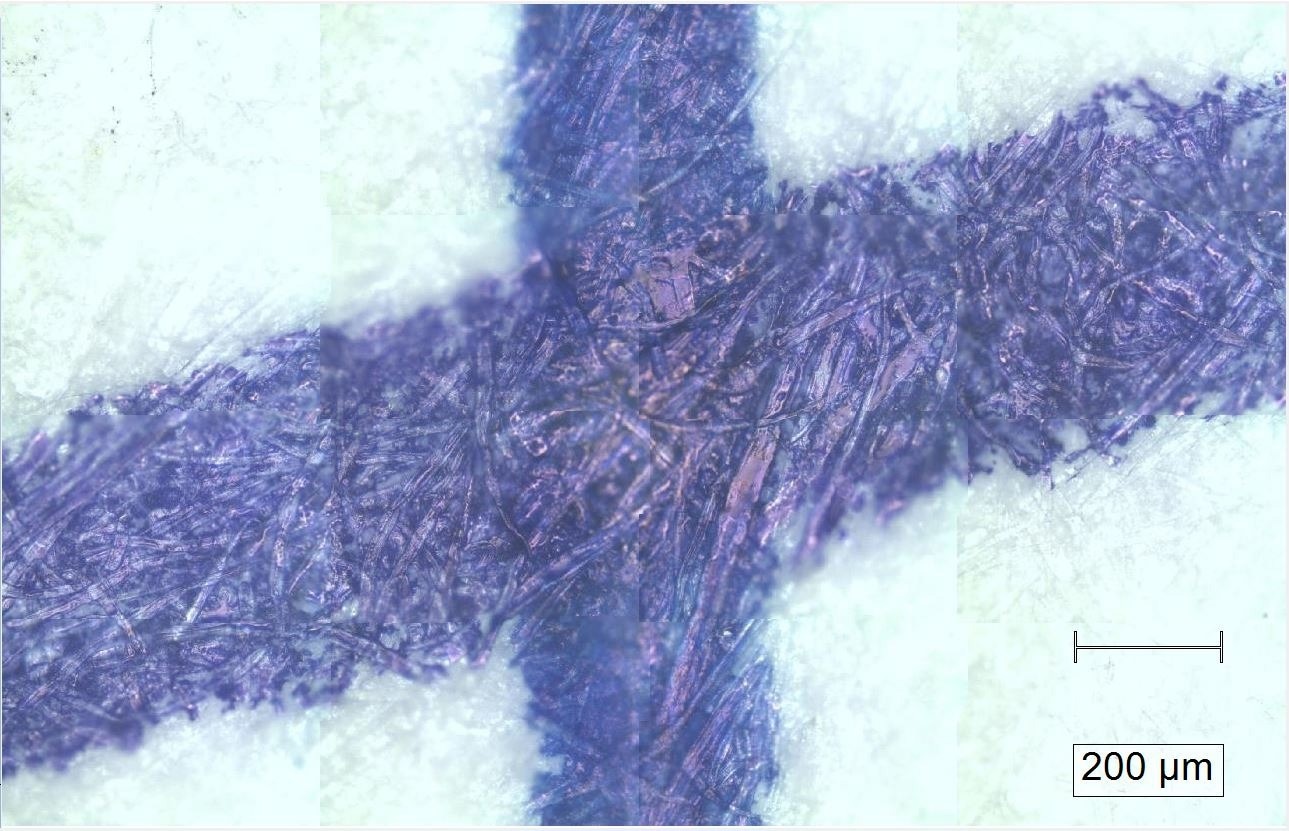
White light image of ink crossing. The region between the two lines defines the crossing. The uncrossed ink sections were masked and pure references were obtained for component analysis. Image Credit: Renishaw plc – Spectroscopy
Component analysis can be performed to obtain false color images that display the distribution of each component on top of the white light image, once there is a reference for each ink.
Historically, the user would have to threshold the false color image and establish the crossing order. The darker ink image in the crossing region was assumed to be on the bottom layer, given that darker areas indicate less similarity to the reference. However, it could not be guaranteed that two independent users would threshold the image in the same manner and arrive at the same conclusion. The ink order can potentially be interpreted either way, depending on the image. How can this pitfall be alleviated? Another data analysis tool provides the solution to this issue: Concentration Estimates.
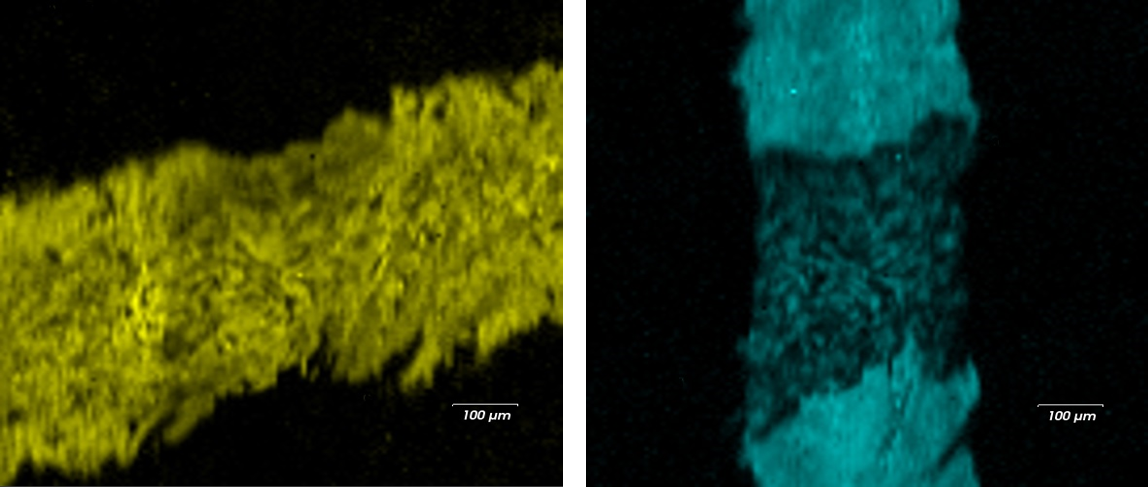
False color Raman images of the two different pen strokes. These images demonstrate the chemical specificity of Raman spectroscopy, ink species are identified and relative concentrations of each ink can be determined. Image Credit: Renishaw plc – Spectroscopy
The total percentage contribution from each ink is determined by the Concentration Estimates tool based on the component analysis Raman image. This process is independent of image thresholding, which therefore guarantees highly consistent results between users. The ink that is more prevalent in the crossing area corresponds to the larger concentration estimate value. The confidence in the ink deposition order depends on the magnitude of difference in the concentration estimate of each ink.
Similarly, the concentration estimate of the pure regions indicates the high specificity between the references. There is therefore a statistically meaningful value to provide confidence in the determination of the ink deposition order.
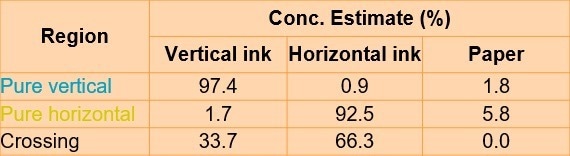
Table 1. This table displays the concentration estimate value of each ink at the pure ink and crossing regions. The pure regions confirm the chemical specificity of the technique. The large difference in concentration at the crossing gives confidence in the proposed deposition order. Source: Renishaw plc – Spectroscopy
And there you have it; you now know how disputes of forgery or alteration are spectrographically analyzed and resolved with the help of Renishaw's InVia Raman microscope. We hope you can continue to sign off legal documents care-free, until a new standard in document authentication sweeps across the globe. We will tackle that challenge when it arises, with the same precision and enthusiasm we pursue across our entire range of applications.
Acknowledgments
Produced from materials originally authored by Lewis Mitchell, Applications Scientist from Renishaw.

This information has been sourced, reviewed and adapted from materials provided by Renishaw plc - Spectroscopy.
For more information on this source, please visit Renishaw plc - Spectroscopy.