Sponsored by EDAXFeb 1 2023Reviewed by Olivia Frost
Using dual EDS detectors offers several benefits for mapping particles or samples. Not only does it increase the throughput while preserving the energy resolution of a single detector, but it also helps to reduce the impact of shadowing and topographic artifacts on samples with uneven or fractured surfaces. On flat and smooth surfaces, they provide more statistics for higher quality and accurate mapping data.
For samples that may not be considered ideal, the use of dual detectors can help to reduce the artifacts caused by shadowing and topography. In these cases, X-rays emitted from particles or small objects may be blocked by larger objects nearby, leading to a decrease in signal strength.
When examining samples with severe surface topography, the artifacts caused by shadowing and topography can be significant. High topography regions can block X-ray signals from lower regions, leading to signal attenuation. Surfaces inclined towards the detector or tilted away from it can result in variations in take-off angles, further altering X-ray signal intensity.
When using an electron beam to scan over a particle, the take-off angle also varies as the beam moves across the spherical surface of the particle. To understand the advantages of dual EDS detectors, EDAX employed Octane Elite Super (detector 1) and Octane Elect Super (detector 2) Silicon Drift Detectors at different azimuthal angles and acquired EDS map data from ideal and non-ideal samples using APEX™ Software.
Results and Discussion
Using dual EDS detectors results in higher-quality map data or collection efficiency. For this example, a floor tile sample with a flat and smooth surface was mapped. Figure 1 shows the SEM image, CPS map, and ROI maps of selected elements from both detectors.
The CPS map (Figure 1b) illustrates the X-ray count rate at each pixel in the dataset, where brighter pixels indicate areas with higher count rates. The sample has many calcium phosphate and zirconium silicate grains as notable features.
However, the elemental maps of P K and Zr L (Figures 1e and 1f) seem similar, despite some grains having different signal intensities. This is due to P K and Zr L peaks being heavily overlapped, with only 29 eV energy difference. The ROI maps are based on raw X-ray counts alone, peak overlaps are not considered. To resolve the overlapping peaks, background subtraction, peak deconvolution, or running full quantification routines at each pixel in the dataset is needed.
The Wt% maps of P K and Zr L in Figure 2 were reconstructed from a single detector and summed ROI maps. The Wt% maps of P K (Figures 2a and 2b) contain slight noise pixels in the bottom right caused by the silicon-rich phase shown in Figure 1c. The Zr L maps (Figures 2d and 2e) have more obvious noise pixels mainly due to iron-rich inclusions and residuals of the phosphorus phase in Figure 1d.
These noise pixels cannot be distinguished from the background because of a lack of statistics. In the maps reconstructed from summed ROI maps (Figures 2c and 2f), many of the noise pixels have been eliminated and the backgrounds appear much more consistent due to using summed statistics from the two detectors.
When conducting background subtraction and peak deconvolution, the total counts are paramount. By summing the X-ray counts from dual detectors, the number of counts per pixel can be increased, leading to improved and more accurate results.
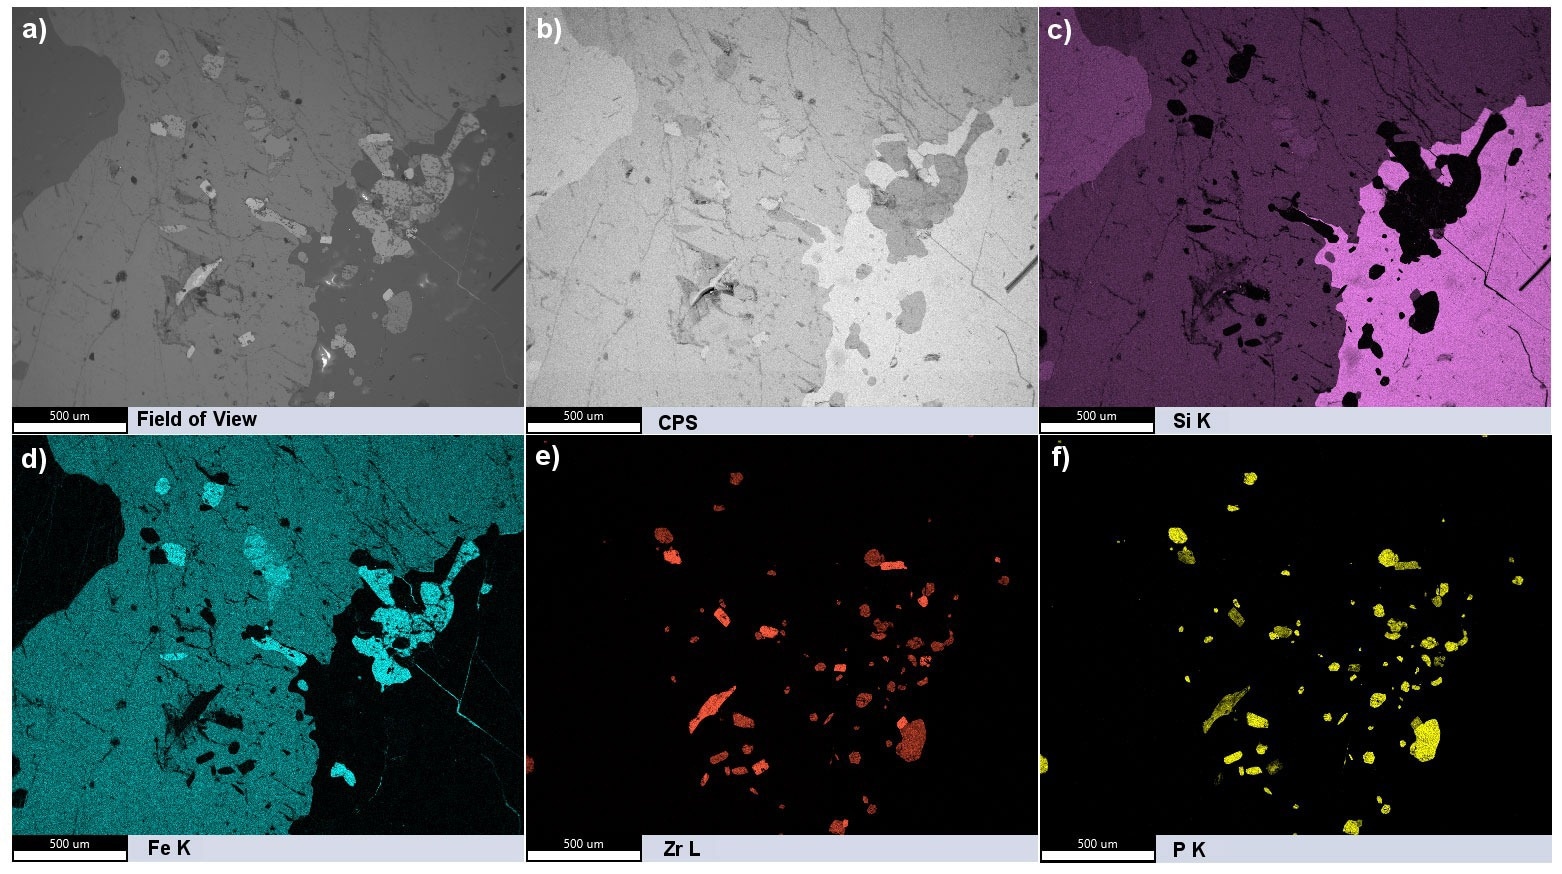
Figure 1. Overview of the dual detector data from a floor tile sample. An a) SEM image and b) summed CPS map of the field of view. c-f) Summed ROI maps of Si K, Fe K, Zr L, and P K, respectively. Image Credit: EDAX.
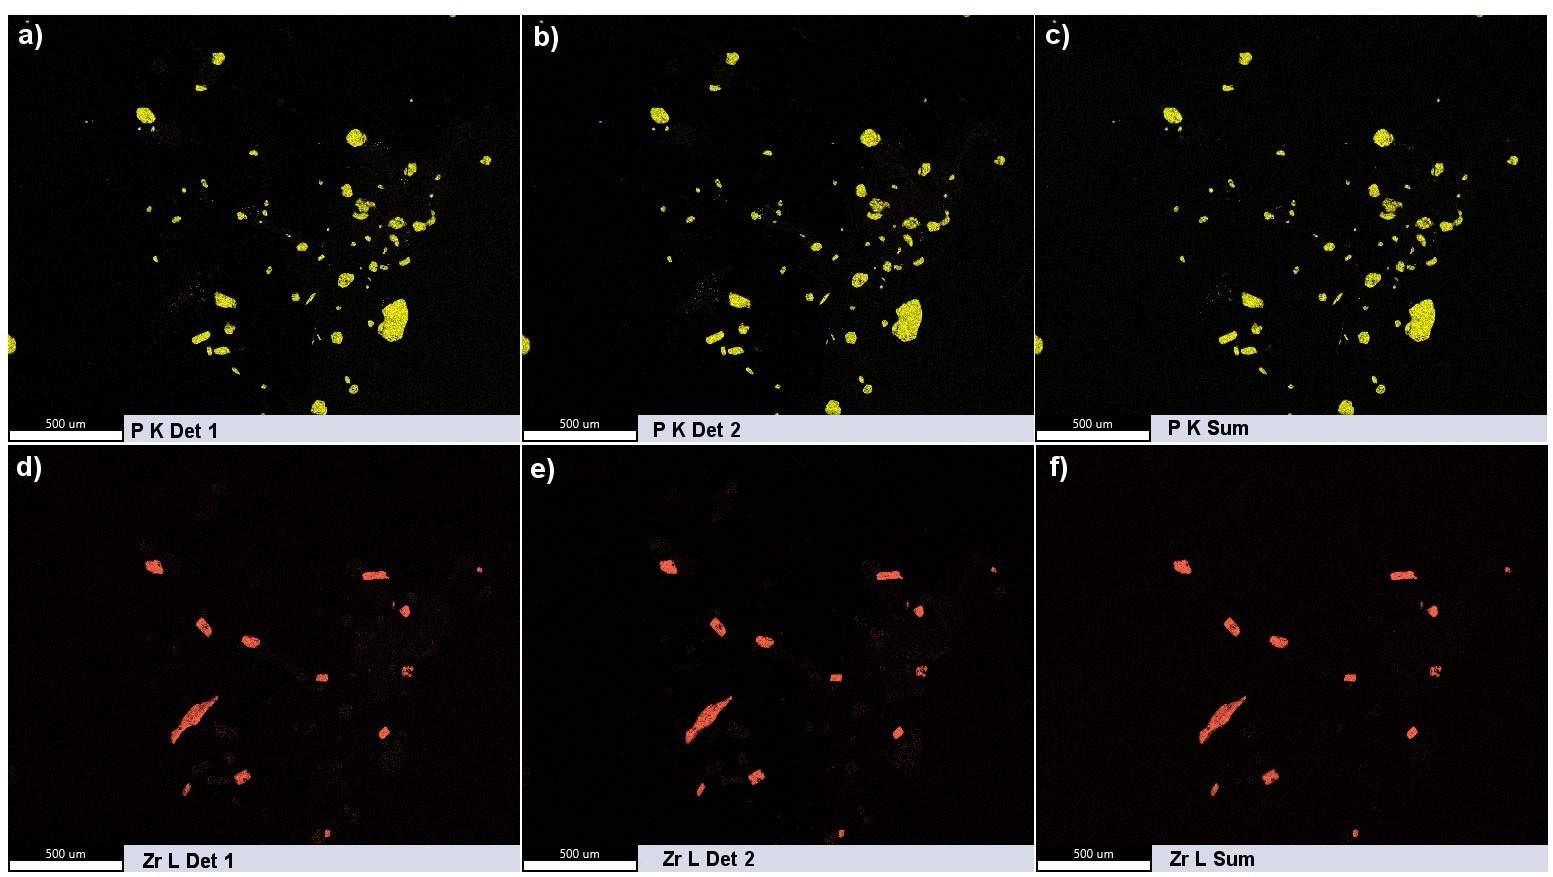
Figure 2. Wt% maps of P K rebuilt from counts from a) detector 1 and b) detector 2, and c) the summed counts from both detectors. d-f) Corresponding Zr L maps of the above maps. A processed high-contrast and brightness version of this figure is shown in Figure 3. Image Credit: EDAX.
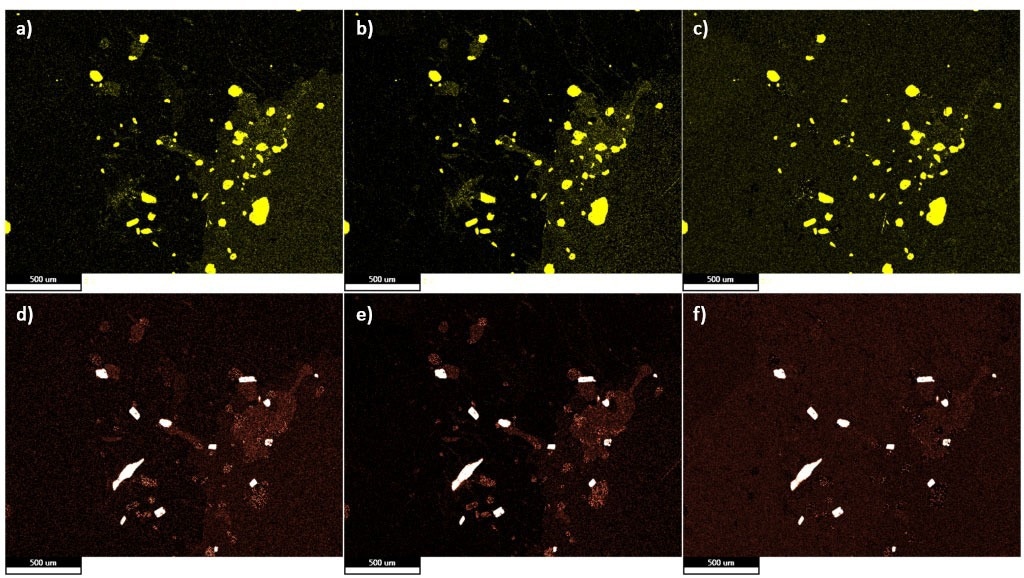
Figure 3. High-contrast and brightness image of Figure 2 to highlight the background outside the calcium phosphate and zirconium silicate grains. Image Credit: EDAX.
Dealing with artifacts from non-ideal samples is more difficult when mapping with a single detector. In this experiment, quartz particles were mapped simultaneously with dual detectors, and the two data sets were combined. The CPS and elemental maps obtained were used to assess the topographic and shadowing artifacts displayed by the sample.
The black areas in these maps indicate signal attenuation, meaning that the detector receives little to no X-rays. In the CPS map collected by detector 1 (Figure 4a), the circled dark region demonstrates where adjacent particles shadow X-ray signals.
In contrast, the corresponding region in the map from detector 2 (Figure 4b) is facing toward the detector, resulting in more X-ray counts being received by the detector.
By summing these two maps, the number of counts per pixel increases, resulting in the shadow artifacts from both detectors being visible (Figure 4c). However, by using the maximum signal at each pixel between the two single detector CPS maps, as seen in Figure 4d, the double shadowing and topography artifacts are significantly reduced. This method does not improve statistics or spectral quality as the signal from only one map or the other is used.
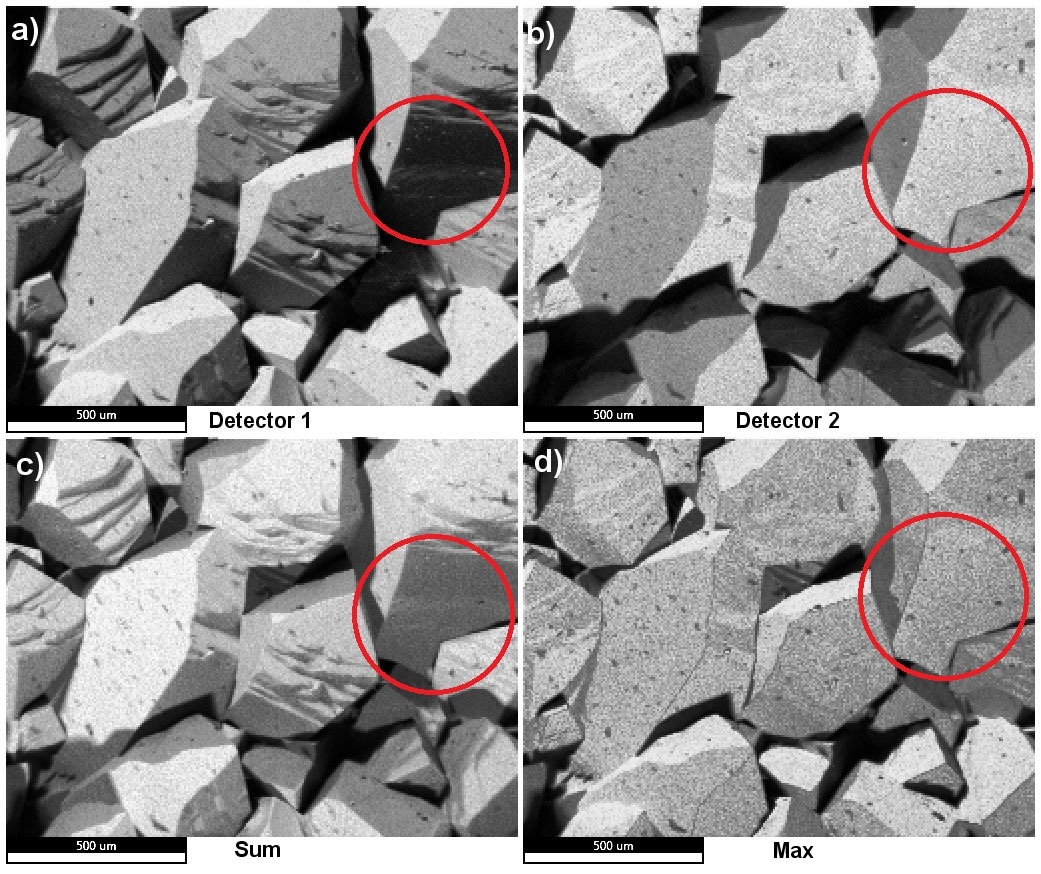
Figure 4. CPS maps of quartz particles from a) detector 1 and b) detector 2, c) the sum of the CPS maps from both detectors, and d) the maximum signal CPS map. Image Credit: EDAX.
When conducting contamination assessments or failure analyses, it is imperative to thoroughly examine as many relevant objects as possible. In one such instance, a sample of iron oxide was analyzed using a dual energy dispersive spectroscopy (EDS) detector setup to determine the distribution of phosphorus as surface contaminants.
The results of the chemical composition maps produced by the dual EDS detectors indicate that the sample in question has a highly irregular fracture surface with distinct shadow zones (as depicted in Figures 5a and 5b).
Despite the presence of a significant quantity of phosphorus particles, as indicated by the P K maps, and a relatively uniform distribution (as illustrated in Figures 5d and 5e), there are observable gaps in the circled areas of both elemental maps.
The topographical variations in the single detector chemical composition maps are alleviated in the merged map generated using the maximum signal function, as seen in Figure 5c.
The shadowing is effectively resolved in the maximum signal P K map, resulting in more precise data representation, as shown in Figure 5f. To evaluate the enhancement in data quality, the three chemical composition maps were transformed into binary images, and the density of phosphorus particles was measured.
The density of particles on the sample surface was determined to be 6504 particles/mm² and 6178 particles/mm² from maps collected by detector 1 and detector 2, respectively. However, the density in the merged map, which was generated using the maximum signal function, was 7795 particles/mm², indicating that neither detector captured a significant number of particles on the sample surface.
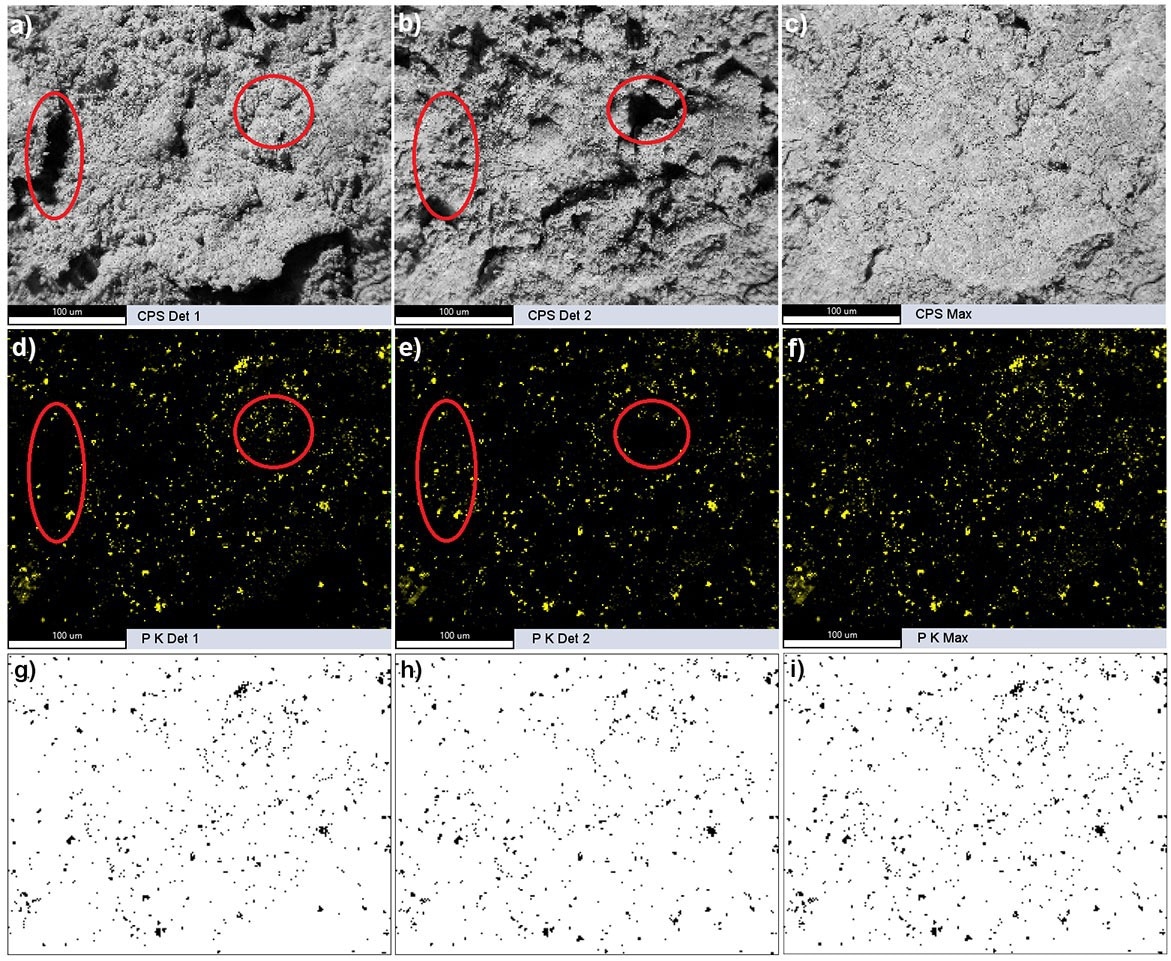
Figure 5. CPS maps collected from a) detector 1 and b) detector 2, and c) the maximum signal CPS map. d)-f) Corresponding elemental maps of P K of the above maps. The red circles highlight regions with missing signals from either detector. g-i) Binary images of the above elemental maps. Image Credit: EDAX.
Conclusion
By utilizing the same conditions, the use of dual detectors allows for a twofold increase in throughput while still maintaining the resolution of a single detector. This results in the generation of higher-quality map data or a reduction in data collection time. For samples that cannot withstand high beam currents, dual detectors provide the ability to acquire improved map data using lower beam currents.
In cases involving non-ideal samples, the utilization of dual EDS detectors proves to be highly beneficial in addressing the shadowing and topographic effects commonly associated with particles on rough or fractured surfaces.
Selecting the maximum signals from the two sets of maps generated by dual detectors is a more effective method of resolving these artifacts than simply summing the maps.

This information has been sourced, reviewed and adapted from materials provided by EDAX.
For more information on this source, please visit EDAX.