Sponsored by EDAXFeb 10 2023Reviewed by Olivia Frost
Characterizing the microstructure of compounds and phases present in a sample is crucial for determining the relationship between processing history and material properties.
Over the last 20 years, techniques such as Electron Backscatter Diffraction (EBSD) pattern analysis and Energy Dispersive Spectroscopy (EDS) have been instrumental in developing materials with improved properties.
However, these techniques are often used in isolation, which can limit the effectiveness of the analysis, delay the time it takes to obtain answers, and require a higher level of technical expertise.
With the use of Chemical Indexing Scan (ChI-Scan™), the elemental information obtained from EDS is utilized to guide the crystallographic analysis from EBSD measurements. This approach automatically enables accurate microstructural analysis of all phases present, both collectively and individually.
Advantages of ChI-Scan
- Avoid analysis ambiguity from sample preparation and/or plastic deformation
- Diminish processing time ten-fold with guided analysis based on eligible crystallographic structures
- Decrease data collection times from hours to minutes when differentiating phases with the same crystal structure and dissimilar lattice constants
- Distinguish constituent phases with the same cubic crystal structure and similar lattice constants
- Analyze all phases that are present in a sample
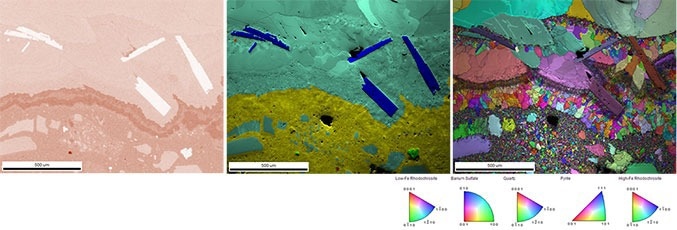
Figure 1. ChI-Scan analysis enabled the texture of a polyphase mineral to be exposed. Using ChI-Scan, two distinct rhodochrosite phases were discovered through variation in the iron content (left). The phase map (center) shows low-iron rhodochrosite (cyan), high-iron rhodochrosite (yellow), and other phases, including barium sulfate (blue), quartz (red), and pyrite (green). IPF Orientation combined with Image Quality map of the same sample (right). Image Credit: EDAX.
ChI-Scan
The crystalline structure and orientation of analysis points inside a material are identified by EBSD, giving comprehensive microstructural information. However, when two or more phases with identical crystallographic structures are detected in a sample, determining the proper structure can be challenging.
ChI-Scan uses EDS compositional information to narrow down the possible crystallographic structures at each measurement site to just those with adequate chemistry, resolving ambiguity.
This permits discrimination of phases with comparable crystal structures and speedier data collection since the standards for high-quality EBSD data (signal-to-noise ratio and resolution) are eased. Microstructures with more than ten distinct phases were examined using ChI-Scan.
Microanalysis Results
The relevance of ChI-Scan in the microstructural investigation of a printed circuit board's metallic interconnects is highlighted in this example. Copper and Kovar interconnects were deposited utilizing a multi-step electrochemical deposition process.
Kovar is an iron-nickel-cobalt alloy with a coefficient of thermal expansion close to borosilicate glass. Metal components glued to durable glass envelopes are employed in the electronics sector.
Understanding and controlling the impacts of processing on the characteristics of the two materials requires an understanding of their microstructures, specifically the grain size distribution.
When done in isolation, EBSD analysis with the VelocityTM Plus EBSD Detector correctly indexed 99.8% of the points, yielding high-quality orientation maps revealing comprehensive microstructural characteristics such as grain size, crystalline structure, and twin boundaries.
Due to the similarities in crystal structure between these two phases, it was difficult to comprehend each phase's microstructure and interactions. The phase map shows a random selection of two Face-Centered Cubic (FCC) phases that correlate to copper and Kovar but have no relevance to the observed microstructural characteristics.
Copper and Kovar are both FCC materials with similar diffracting planes and lattice constants, making EBSD separation challenging.
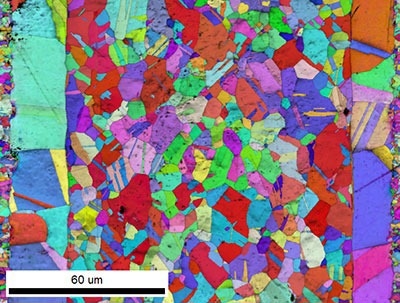
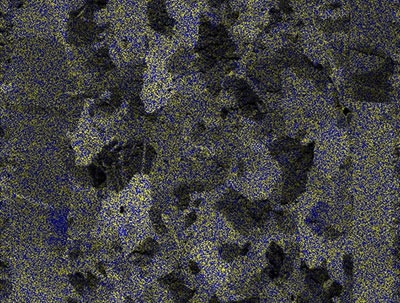
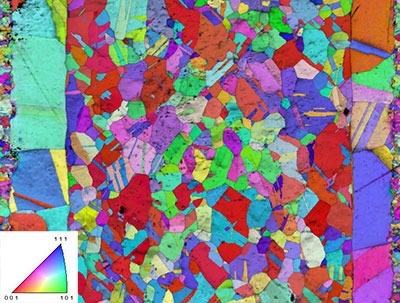
Table 1. EBSD orientation maps were collected at >3,000 indexed points per second using a Velocity Plus EBSD Detector. Source: EDAX
| |
EBSD |
|
EDS |
|
Phase Map |
| EBSD |
 |
+ |
– |
= |
 |
| ChI-Scan |
 |
+ |
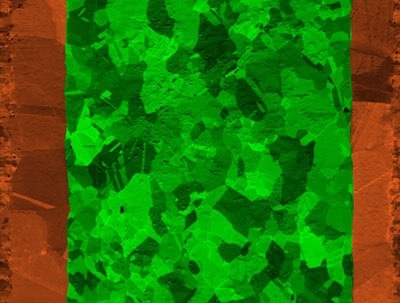
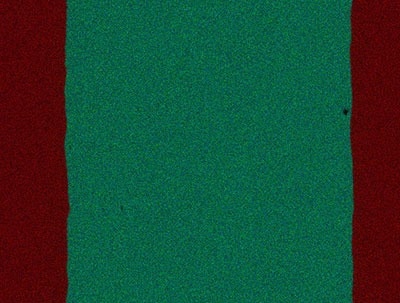 Elemental map by EDS was collected simultaneously with EBSD data using an Octane Elect Super Detector. Colorized to display copper (red), iron (green), and nickel (blue). Elemental map by EDS was collected simultaneously with EBSD data using an Octane Elect Super Detector. Colorized to display copper (red), iron (green), and nickel (blue). |
= |
 Phase maps were determined from data. Colorized to display copper (top - blue, bottom - orange) and Kovar (top - yellow, bottom - green). Phase maps were determined from data. Colorized to display copper (top - blue, bottom - orange) and Kovar (top - yellow, bottom - green). |
However, the simultaneous gathering of elemental maps and analysis with ChI-Scan allows copper and Kovar to be differentiated and correct phase maps to be obtained. The quantitative microstructural investigation is now feasible, and the grain size distributions from both phases are depicted in Figure 2.
The copper phase displays a bimodal grain size distribution, with bigger grains near the Kovar contact and smaller grains distant from it, indicating that two separate deposition and grain growth processes were engaged during the deposition process. The grain distribution in the Kovar phase is more homogenous.
According to grain misorientation analysis, the Kovar phase displays extensive twinning (about 50% of the grain boundaries within the phase). The copper phase has much fewer twin boundaries (about 7%). This level of detail would not be achievable without the precise phase distinction offered by ChI-Scan.
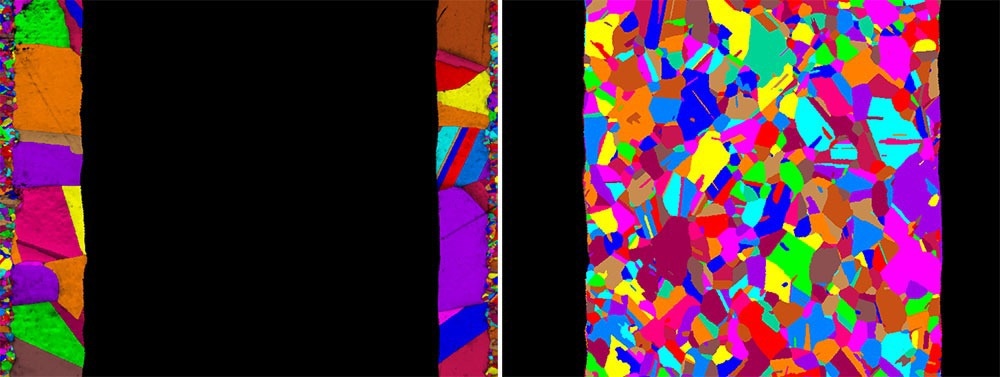
Figure 2. EBSD grain maps for the copper phase (left) and Kovar phase (right) showing a bimodal grain structure for the copper phase. Image Credit: EDAX.
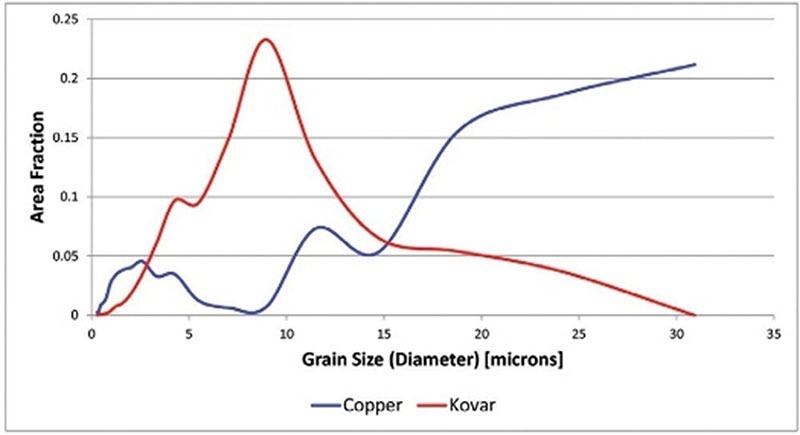
Figure 3. Grain size distributions for the copper and Kovar phases. Image Credit: EDAX.
Conclusion
The ChI-Scan feature in EDAX Pegasus Systems enables:
- Accurate phase mapping for scientists and engineers analyzing multi-phase materials by removing ambiguities in EBSD pattern analysis
- Rapid determination of essential data by allowing lower-quality EBSD patterns to be utilized
- Improved analytics for quantitative analysis of all phases in a material
ChI-Scan can analyze metallic, ceramic, semiconductor, and geological samples, such as carbide analysis in steels, oxide phase characterization in rare earth magnets, inclusion studies in aerospace alloys, and mineral analysis in copper ore-containing rocks.
ChI-Scan requires EDS and EBSD data acquired concurrently utilizing EDAX EDS and EBSD detectors.

This information has been sourced, reviewed and adapted from materials provided by EDAX.
For more information on this source, please visit EDAX.