Low ppb detection limits down to sub-ppb levels are often required for many gas purity applications. Atmospheric pressure ionization mass spectrometry (APIMS) is often used as the analytical tool for these applications as it can obtain low to sub ppb detection limits. This article discusses the determination of the lower detection limits (LDL) of one such instrument from Process Insights.
Experimental Procedure
The determination of LDL of the Process Insights APIMS is performed by passing a calibration gas and bulk gas via a flow controller and then into the API source, which uses a ‘Point to Plane Discharge’ of 5 kV for ionization of the bulk nitrogen. The ionized bulk gas is then ionized the analytical gas as in most API systems. All wetted surfaces are heat traced to increase the adsorption/desorption rates of molecular layers on the surfaces of the stainless steel inlet and source. After ionization, the plasma is then passed through a tiny aperture, via a declustering region (2.5E-6 torr) and a 19 mm quadrupole mass filter, and then gathered by a pulse counting electron multiplier (1.7 E- 7 torr).
The calibration gas contains 1.2 ppm carbon dioxide with a balance of nitrogen and is controlled using a mass flow controller at the rates of 1.0, 0.8, 0.6, 0.4, 0.2 scc/min. The bulk gas utilized is an adiabatic expansion of liquid nitrogen controlled at a rate of 2L/min by a mass flow controller, thus achieving a dilution factor of 2,000 to 1. The mass spectrometer is slowly monitored, providing30 seconds of measurement time for each mass. Carbon dioxide (m/z 44) is utilized for the LDL calculations.
Results
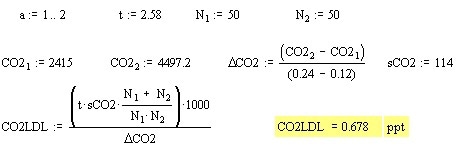
Detection limits were computed in MathCAD through the use of the following formula:
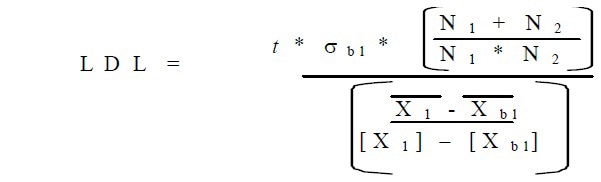
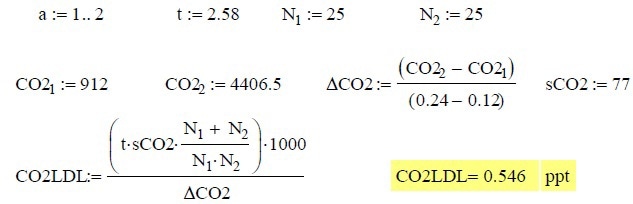
The t value utilized, was 2.58 for a 99% confidence level over 25 measurements. This same number of measurements was utilized for N1 and N2 for adjusting the degrees of freedom. The actual calculations imported from MathCAD are shown in below:
The Excel tables utilized for these calculations are shown in Table 1:
Table 1. Results
| SCC/min Sample in 2L/min N2 |
0.2 |
|
|
m/z 44 |
m/z 45 |
| Average |
81729 |
2468 |
| Stdev |
6920 |
277 |
| RSD |
8.5% |
11.2% |
| Adj. Average (cps) |
912 |
28 |
| Adj. Stdev (cps) |
77 |
3 |
| Calc. Conc. (ppb) |
0.120 |
0.001 |
| SCC/min Sample in 2L/min N2 |
0.4 |
|
|
m/z 44 |
m/z 45 |
| Average |
394822 |
7077 |
| Stdev |
18952 |
813 |
| RSD |
4.8% |
11.5% |
| Adj. Average (cps) |
4406.5 |
79.0 |
| Adj. Stdev (cps) |
211.5 |
9.1 |
| Calc. Conc. (ppb) |
0.240 |
0.002 |
| Delta (cps/ppb) |
29120 |
42869 |
In the above tables, the average value is actually the average of the 25 measurements. This figure is the area under the curve of each peak and is converted to counts per second (cps) by dividing the value by 128 (Merlin Automation conversion factor) and 0.7 (peak width). This same adjustment was carried out to convert all values to cps.
The Delta calculation is the ratio between the change in peak intensity and the change in concentration to yield a value in cps/ppb. The raw data acquired with the Merlin Automation Data System is shown in Figure 1.
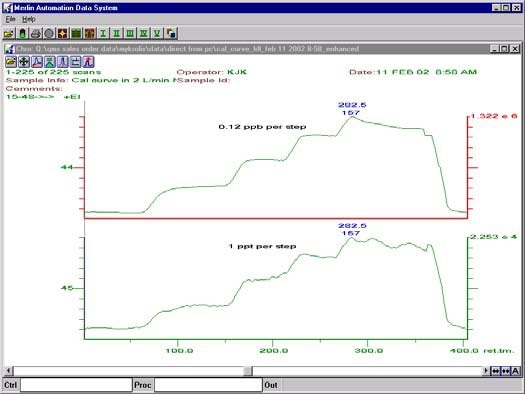
Figure 1. Raw data from experiment
The acquisition started with a sample flow at a rate of 0.2scc/min, with each step ascending by 0.2scc/min. This equates to a Δ[CO2] of 120 ppt. Hence, subsequent to the isotope ratio of 12C to 13C of 1.1%, this provides a calculated Δ[CO2] at m/z 45 of roughly 1 ppt.
The calibration curves for m/z44 and m/z45 as they were plotted in Excel are shown in Figure 2.
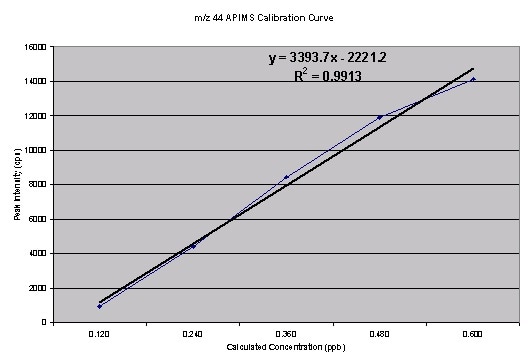
Figure 2. Calibration curve for m/z 44
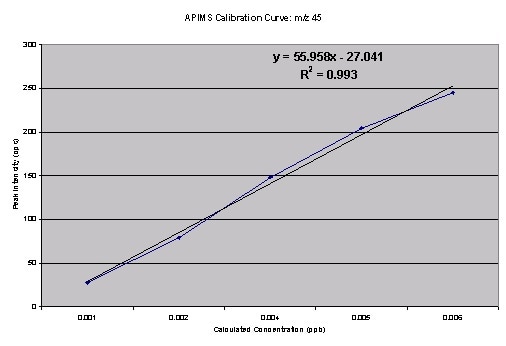
Figure 3. Calibration curve for m/z 45

The isotope ratio m/z45 and m/z44 computed from the above data is roughly 3%. The source of this error may be due to the following sources:
- A tail from m/z 44 bleeding into m/z 45
- An interfering background peak at m/z 45
- An interfering peak at m/z 45 from a protonated CO2
These possibilities were analyzed as follows:
- It may be possible to eliminate a tail from m/z 44 by narrowing the resolution of the quadrupole, followed by rerunning of the complete calibration curve with 50 data points at each calibration step (N=50).
- An interfering background peak at m/z 45 can be analyzed by computing the isotopic ratio from the variation between two data points.
- An interfering peak at m/z 45 from a protonated CO2 was discounted and protonated water would be the best source of a proton.
Results of narrowed resolution experiment are shown in Table 2.
Table 2. Results of narrowed resolution experiment
| SCC/min Sample in 2L/min N2 |
0.4 |
|
|
m/z 44 |
m/z 45 |
| Average |
216345 |
5930 |
| Stdev |
10243 |
960 |
| RSD |
4.7% |
16.2% |
| Adj. Average (cps) |
2415 |
66 |
| Adj. Stdev (cps) |
114 |
11 |
| Calc. Conc. (ppb) |
0.120 |
0.001 |
| SCC/min Sample in 2L/min N2 |
0.2 |
|
|
m/z 44 |
m/z 45 |
| Average |
402952 |
8176 |
| Stdev |
15962 |
1025 |
| RSD |
4.0% |
14.3% |
| Adj. Average (cps) |
4497.2 |
91.2 |
| Adj. Stdev (cps) |
178.2 |
11.4 |
| Calc. Conc. (ppb) |
0.240 |
0.002 |
| Delta (cps/ppb) |
17356 |
20884 |
| LDL (ppt) |
5.09 |
0.54 |
The calculations imported from MathCAD are shown below:
From the data, the isotope ratio calculated was roughly 2.7%. Even though the value is nearer to to the natural abundance, it is still erroneous. Taking into account the above possibility of an interfering background peak at m/z 45, the Am/z 45/Am/z44 can be observed for the narrowed resolution experiment. This results in an isotopic ratio of 1.20%. Narrowing the resolution and taking into account the deltas of the two data points, better results were produced, because the isotopic ratio must be 1.18% (1.1% from 13C and 0.04% from each of the 18O isotopes). The resultant calibration curves are shown in Figures 4, 5 and 6.
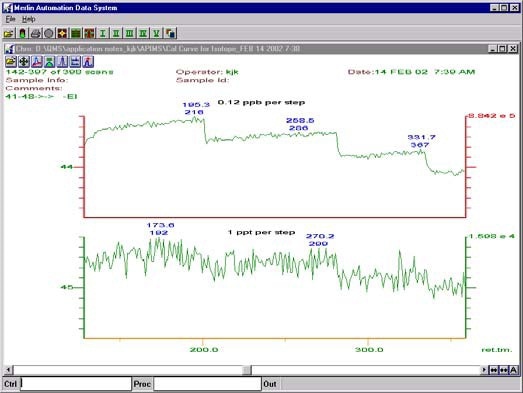
Figure 4. Raw data from narrowed resolution experiment
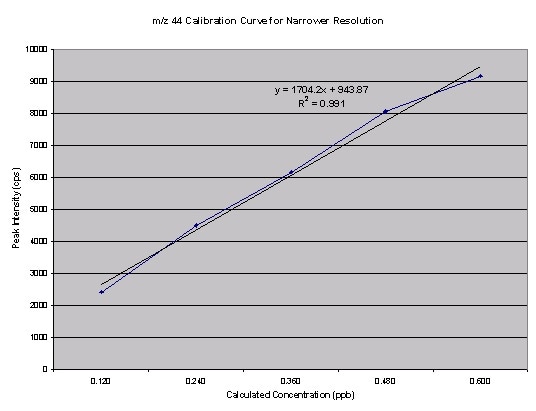
Figure 5. Narrowed resolution m/z44 calibration curve
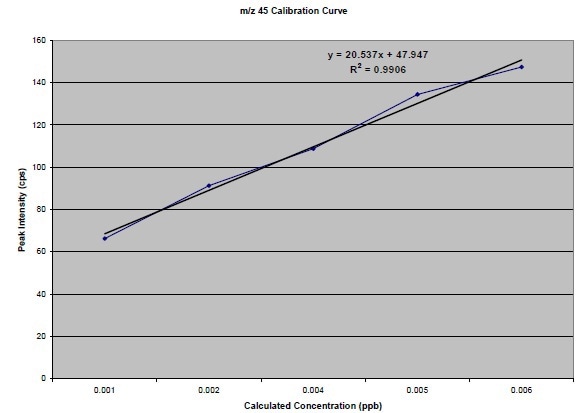
Figure 6. Narrowed resolution m/z45 calibration curve
Conclusion
The signal to noise is carefully optimized in this system by carefully performing the following noise reduction measures:
- Replacement of the electron multiplier
- Cleaning of the Point-to-Plane Discharge source with 10 kV
- Careful adjustment of the counting preamplifier discriminator level
- Braided ground straps are connected to all components such as the quadrupole power supply, data system, both analog and counting preamplifiers, and the chamber itself
- All optics are carefully tuned with special focus on Pole Bias and the (now isolated) quadrupole housing/faraday plate.
Moreover, the inlet system has been constantly heated and the bulk gas has constantly passed through it for over one week. The continuous gas flow made all wet surfaces to reach equilibrium. The bulk gas was passed through a getter/purification system. The achieved detection limits are outstanding as well as repeatable.

This information has been sourced, reviewed and adapted from materials provided by Process Insights - Mass Spectrometry.
For more information on this source, please visit Process Insights – Mass Spectrometers.