This article examines the reverse engineering of existing drug products using Raman imaging. There are a number of regulatory routes with the FDA through which a company can seek approval for a generic drug. The Abbreviated New Drug Application (ANDA) route is the most notable. This is when an exact copy of the innovator product is developed by a generic company and the safety and efficacy data from the innovator can be applied for the purpose of their submission. Senator Orrin Hatch and Representative Henry Waxman sponsored the facilitation of this route in the 1980s through the Drug Price Competition and Patent Term Restoration Act and, as such, it is informally known as the Hatch-Waxman Act.
At the time, the US government had concerns about the low number of generic drug approvals. Prior to the Hatch-Waxman Act, legal obstacles could easily be created by innovator companies that would prevent other companies from developing generic medicines. This made generic drug development a very unattractive industry. Many of these obstacles were removed by the Hatch-Waxman Act, which then successfully incentivized generics companies to produce affordable generic medicines. At the same time it also protected innovator companies by granting them a sufficient exclusivity period after the initial release of their drug, which maintains innovation pro table.
The alternative route for generic drug approvals is 505(b)(2). It is used for drug product submissions that may contain reports of safety and effectiveness investigations taken from prior studies that were performed on a chosen reference product. However, the format of the drug is intentionally different to that of the reference product. The repurposing of existing drugs for new indications or reformulating existing drugs for a different delivery route are two prime examples of 505(b)(2) candidates.
The toxicity and safety data generated for the API by a marketed reference product can be used by drug makers in such scenarios. However, the efficacy and effectiveness of their formulation in the clinic will still need to be clearly demonstrated.
There is growing interest in the field of biowaivers when it comes to ANDAs. These are regulatory pathways whereby in vitro testing alone can be used to prove that a generic drug is equivalent to the reference product, negating the need to undergo bioequivalence studies. A drug must exhibit Q1, Q2 and Q3 sameness in order to be considered for a biowaiver.
Table 1.
| Q1 |
Qualitative similarity: the test and reference products contain the same active and inactive ingredients. |
| Q2 |
Quantitative similarity of composition: the same amounts of active and inactive ingredients. |
| Q3 |
Structural sameness (currently reserved for topical medications): equivalent microstructure |
https://www.ncbi.nlm.nih.gov/pmc/articles/PMC4365090/
Formulators need to prove that the same components are contained in the generic product in the same concentrations as the innovator product, in order to prove Q1 and Q2 equivalence in solid dosage forms.
Analysis is typically performed using quantitative techniques such as HPLC.
The final gateway to a biowaiver, Q3 sameness, is, at the moment, reserved for topical formulations where there is little risk of systemic exposure and, as such, small changes in delivery pro le are unlikely to put patients at risk.
Raman Imaging
Components can be identified and amounts quantified using Raman imaging, making it well-suited for identifying Q1 and Q2 sameness.
Whilst Q3 microstructual sameness is not yet applicable to oral solid dose, Raman is able to quantify the microstructure of solid dose forms, including particle/granule size, uniformity and percentage coverage. Perhaps the use of Raman imaging to demonstrate Q3 sameness could form one aspect of a series of tests paving the way for future biowaivers for oral solid dose?
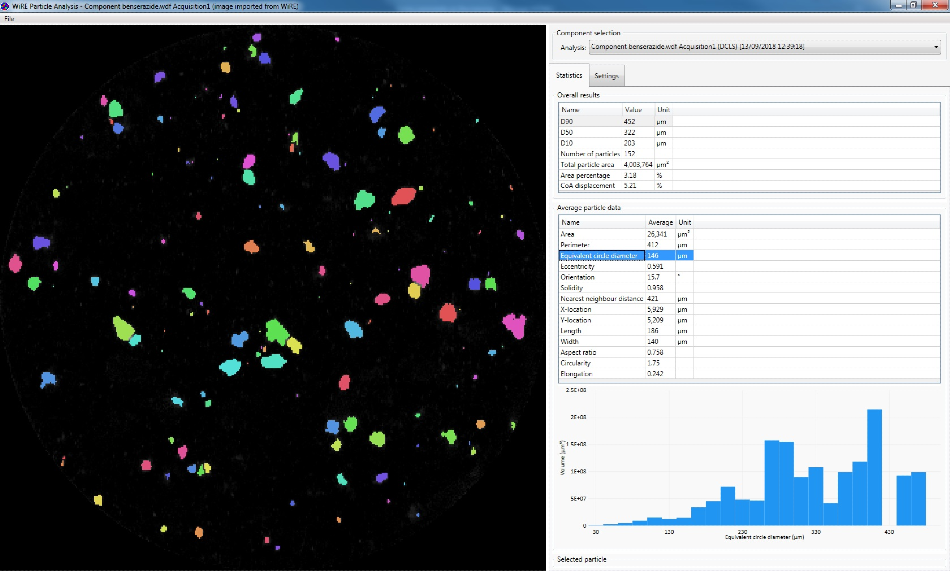
Particle statistics information from Renishaw’s WiRE software.
Thousands of Raman spectra are collected across the surface of a sample in order to determine the microstructure of a formulation. All of the chemical information for a sample point is contained in each pixel, which is made up of a complete Raman spectrum.
Any surface, no matter how rough or smooth, can be analyzed at high speed whilst maintaining image focus using the RA802 Pharmaceutical Analyzer in combination with Renishaw’s StreamLineTM and LiveTrackTM technologies. The analysis time compared to conventional Raman systems is significantly shorter as, at full speed, the system can collect up to 1,500 spectra per second.
Once enough spectra have been collected a complete chemical image of the sample can be generated, including the API, polymorphs, excipients, degradants and contaminants, and all of the requisite components can be segregated using false color.
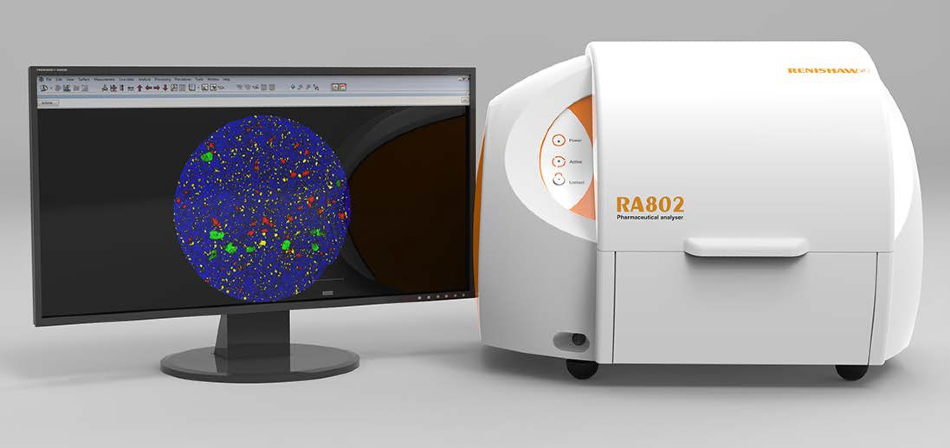
The Renishaw RA802 Pharmaceutical Analyzer.
Comparing Innovator and Generic Products
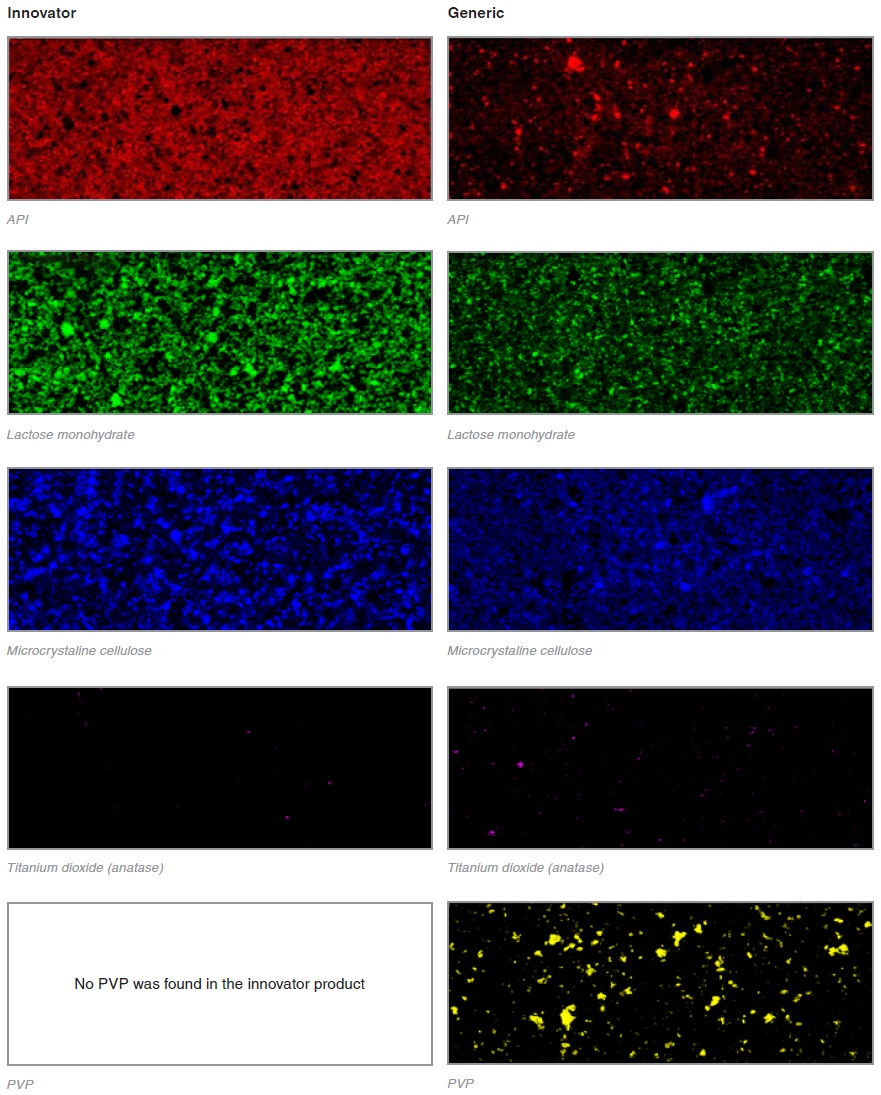
The Raman images of two tablets, an innovator and a generic, are compared.
The different components were identified using the collected Raman spectra. These were then false colored and displayed separately for ease of comparison.
Particle statistics analysis can be performed on the domains and particles within the image once each component has been identified. Comparisons between tablets, batches and products can be made using these statistics in order to identify key differences and diagnose the reasons for those differences.
Particle Size
A comparison was made between particle sizes of the microcrystalline cellulose (MCC) and lactose using the data from the Raman images in order to determine whether there were any significant differences.
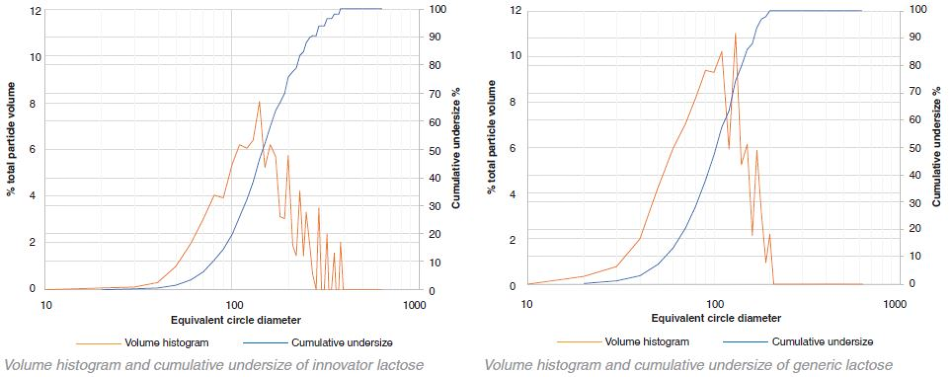
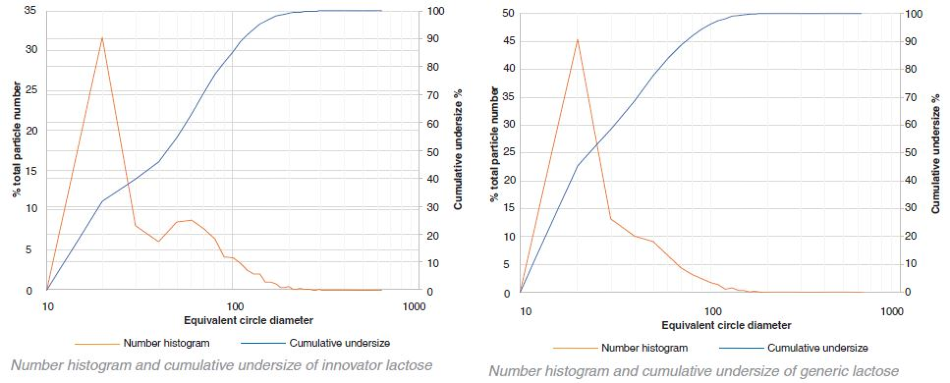
Lactose – innovator v generic volume histograms
Lactose – innovator v generic number histograms
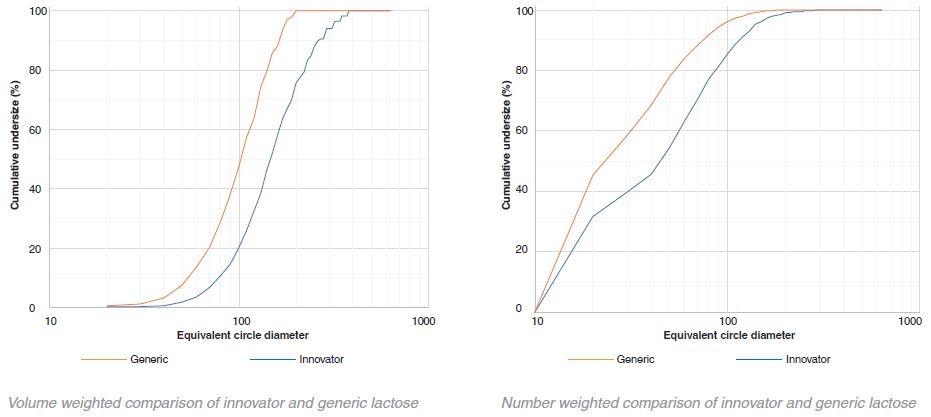
Comparison – innovator and generic lactose – cumulative undersize
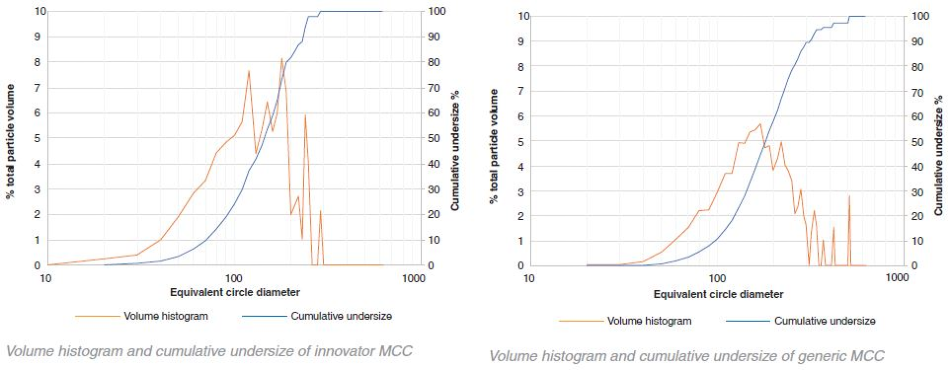
MCC – innovator v generic volume histograms
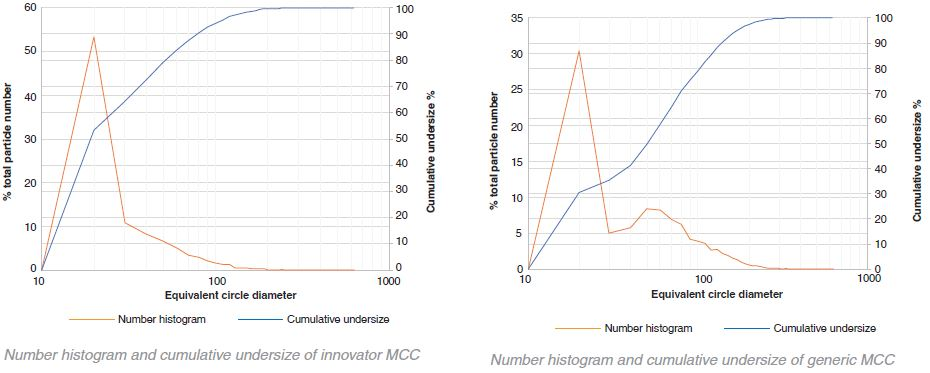
MCC – innovator v generic number histograms
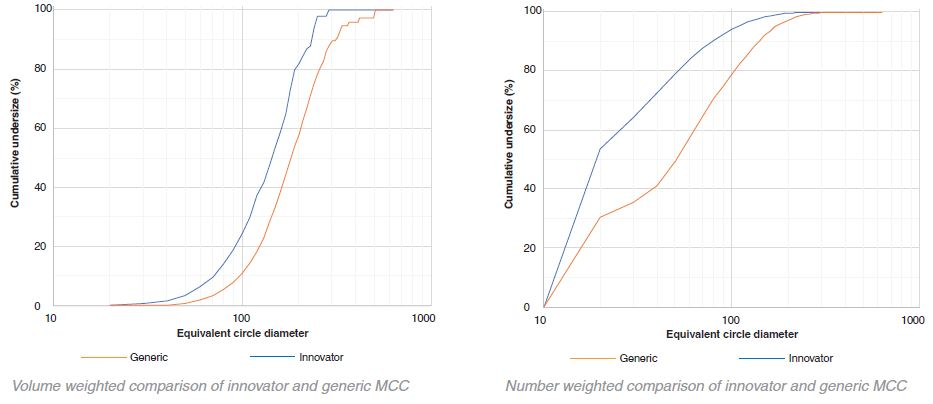
Comparison of generic and innovator MCC – cumulative undersize
Comparison of Generic and Innovator
Table 2.
| |
Lactose |
MCC |
| Generic |
Innovator |
Generic |
Innovator |
| D90 |
164 µm |
253 µm |
298 µm |
218 µm |
| D50 |
100 µm |
142 µm |
178 µm |
135 µm |
| D10 |
49 µm |
76 µm |
92 µm |
63 µm |
| Number of particles |
7385 |
4702 |
4614 |
5936 |
| CoA |
1.37% |
1.13% |
0.18% |
3.16% |
The particle size of the innovator is consistently larger than that of the generic in the case of lactose. In contrast, with MCC the particle size of the generic is larger than the innovator. However, this difference is not as obvious as that of lactose. A small number of very large aggregates occupying a large proportion of the total volume is indicated by the variability in the volume histograms at the higher particle sizes.
In both the generic and innovator products, both MCC and the lactose particles are highly polydisperse as shown by the graphical data. By number, most of the particles were between 10 μm – 20 μm (for this particular sample collection 10 μm was set as the minimum particle size resolution). These particles, however, only occupy a fraction of the total volume. The volume-weighted D50 values for the lactose and MCC in the generic and innovator products were all between 100 μm – 200 μm.
Some bimodal character is demonstrated through the number histograms for the innovator lactose and the generic MCC. The majority of the particles are 10 μm - 20 μm in size. However, a secondary peak between 50 μm – 60 μm is exhibited in both graphs suggesting that the particles were potentially sieved before being added to the tablet blend in order to achieve a specific particle size distribution.
A component’s uniformity is indicated by the center of area (CoA). If a CoA is 0% then throughout the image the component of interest is evenly distributed and the center of the image is the center of area of all the particles. An indication that the component is not evenly distributed is given if there is any offset from 0%. This also indicates that a larger proportion of the component is weighted away from the center.
There was a great deal of similarity between the CoA for the generic and innovator lactose in the formulations. However, in terms of the MCC there was a marked difference in the CoA between the generic and the innovator. The images highlight why this might be the case. There is a more network-like structure to the generic and there appears to be much smaller distances between neighboring particles than with the innovator.
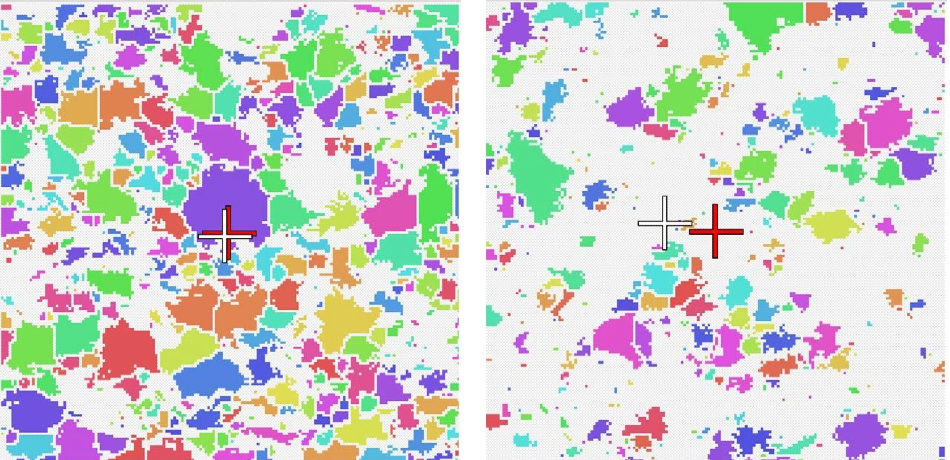
Zoomed in extracts from the Centre of Area (CoA) images for the generic (left) and innovator (right) MCC. The red crosses indicate the centre of the image, the white crosses indicate the CoA. A greater offset can be seen in the innovator image.
Discussion
Table 3.
| Innovator ingredients |
Generic ingredients |
| API |
API |
| Lactose monohydrate |
Lactose monohydrate |
| Titanium dioxide (anatase) |
Titanium dioxide (anatase) |
| |
Polyvinylpyrrolidone (PVP) |
It is very interesting just how different these two products are. The distribution of the APIs even look completely different. The power of Raman imaging is clearly demonstrated here. Even with no background knowledge about the two tablets it is evident that the two products have been made using very different manufacturing processes.
This raises some questions as to the differences in the mixing and tabletting methods which could have led to such differences. Whilst the API has a highly dispersed, nebulous structure in the innovator product, the API forms discreet, aggregated domains in the generic product. Visually, the generic product is more typical of the types of API distribution that would usually be seen.
The innovator product may have gone through a wet granulation step that dissolved or partially dissolved the API which then recrystallized. This would cause a much more uniform dispersion throughout the formulation.
The sensitivity of Raman imaging is really demonstrated by the generic product which contains a mixture of API particles as small as 1 μm along with large agglomerates. It is very difficult to achieve this kind of identification with other techniques. As the API is not bound up in granules, the generic tablet has seemingly been prepared using simple dry powder compaction.
Lactose monohydrate, microcrystalline cellulose and titanium dioxide are contained in both tablets. RA802 has a spectral database of common excipients making these easy to identify.
Another interesting finding was that the generic tablet had an additional ingredient contained within it: polyvinylpyrrolidone (PVP).
This is unusual as the generic product was intended to be a direct copy. It could potentially have been going into a market where the innovator had not yet been launched, or perhaps the plan was to take the product down the 505(b) (2) route.
PVP is a binding agent so another explanation is that the generic polymorph was less ‘sticky’ and, as such, the formulators added an additional binding agent to try and improve the tablet’s robustness. These are all just speculations.
Whilst highly unlikely, in some exceptional circumstances it may be that the FDA would accept an ANDA submission with a differing excipient. However, the generic company would need to provide a sound justification for its inclusion and be able to conclusively demonstrate the pharmaceutical equivalence to the innovator in terms of dissolution and bioequivalence.
Conclusion
Innovator and generic products can be successfully characterized using RA802. It is also able to facilitate deformulation activities.
The components, concentrations, particle sizes and distributions of the innovator formulation can be characterized by RA802, which allows generic followers to alter their processes in order to develop equivalent products, or products which are strategically different.

This information has been sourced, reviewed and adapted from materials provided by Renishaw plc - Spectroscopy.
For more information on this source, please visit Renishaw plc - Spectroscopy.