Introduction
Due to the very good electrochemical performances, the three transition metal oxides, LiMn2O4, LiCoO2 and LiNiO2, have been considered for use as cathode materials in lithium batteries [1-4]. LiMn2O4 is inexpensive material but it shows rather poor cyclic performance [2]. LiCoO2 shows high mobility but it is quite expensive [2] and is toxic. LiNiO2 is a promising cathode material due to its large discharge capacity and low cost [1-3]. Therefore, it is useful to study on the preparation and characterization of this oxide.
There are several methods for preparing Li1-xNi1+xO2. They are the solid state reaction and solution methods [4]. The solid state reaction is very difficult to control the stoichiometry and grain size distribution. Therefore, the solution methods have been developed to overcome these problems. The sol-gel method, one of the solution methods, is selected for the present study. Comparing it to the solid state reaction, the sol-gel method has several advantages such as, easier to control stoichiometry, submicron-size particles and good homogeneity. In addition, shorter-time and lower temperatures are used for the process [4, 5]. The purpose of the research is to find the optimum condition for preparation of Li1-xNi1+xO2 powder by a sol-gel method with subsequent calcination at different temperature and time in air. The optimum condition was determined in order to obtain the product with the best electrochemical performance.
Experimental
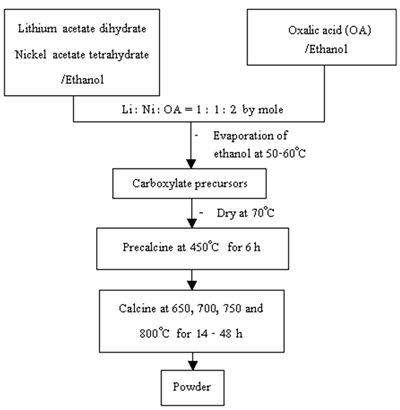
Following similar preparation procedures for the lithium manganese oxide [6], Li1-xNi1+xO2 powder was prepared using lithium acetate dihydrate and nickel acetate tetrahydrate through a mixture of carboxylate precursors as shown in Figure 1. Lithium acetate and nickel acetate were dissolved in ethanol with 1 : 1 mole ratio. Oxalic acid in ethanol was added so that the acid to total metal mole ratio was 1 : 1. The mixture was heated at 50-60oC until the dried precursors were obtained. The precursors were precalcined at 450oC for 6 h and further calcined in air at 650-800oC for 14-48 h. The powder was intensively analyzed using (1) thermogravimetric analyzer (TGA, Perkin Elmer, Model TGA7) with the heating rate of 20oC.min-1 in nitrogen atmosphere, (2) Fourier transform infrared spectrometer (FTIR, Nicolet Instrument Corporation, Model 510 FT-IR) with KBr as a diluting agent and operated in the range 400-4,000 cm-1, (3) x-ray diffractometer (XRD, Siemens, Model D500) operated at 20 kV, 15 mA and Cu-Kα as the target, (4) scanning electron microscope (SEM, JEOL, Model JSM-840A) operated at 20 kV, (5) atomic absorption spectrophotometer (AAS, Shimazu, Model AA-680) to determine the content of lithium and nickel and (6) titration to determine Ni3+ content.
|
|
|
Figure 1. Flow chart for preparation of Li1-xNi1+xO2 powder.
|
Results and Discussion
Weight Loss
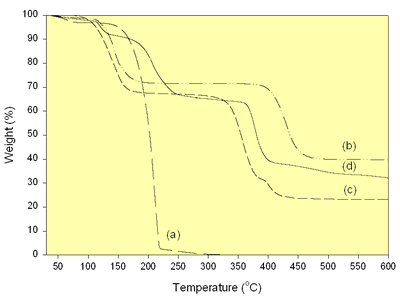
The TGA of the mixture of carboxylate precursors was studied in nitrogen atmosphere to compare with the oxalic acid, lithium acetate dihydrate and nickel acetate tetrahydrate as shown in Figure 2.
|
|
|
Figure 2. TGA of (a) Oxalic acid, (b) Lithium acetate dihydrate, (c) Nickel acetate tetrahydrate and (d) the mixture of carboxylate precursors.
|
The oxalic acid shows two discrete weight loss regions over the range of 40-330°C. They are the evaporation of adsorbed water and the sole oxalic acid at 40-150°C and 150-330°C, respectively. There are two weight loss regions of lithium acetate dihydrate due to the evaporation of adsorbed and lattice water at 40-228°C and the decomposition of acetate ions at 338-470°C [7]. Nickel acetate tetrahydrate shows three discrete weight losses. They are the evaporation of the adsorbed and lattice water, the decomposition of acetate ions and the residual organic constituents at 40-209°C [7], 271-390°C [7] and 390 -500°C, respectively. In case of the mixture of carboxylate precursors, there are four weight loss regions due to the evaporation of ethanol and adsorbed water at 40-144°C, the decomposition of oxalic acid at 150-330 °C, the decomposition of acetate ions from the pyrolysis of lithium and nickel acetates at 330-400 °C and the residual organic compounds at 400-600°C. The oxalic acid is likely to play the role on the decomposition of the acetate ions. The termination of weight loss of the precursors showing that lithium nickel oxides are likely to form at 600°C and higher temperature.
Vibrational Bonding
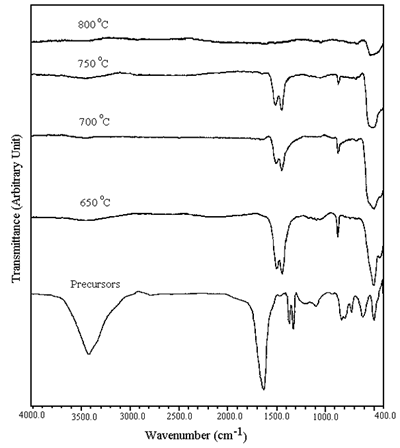
The FTIR spectra of the precursors and the calcined powder are shown in Figure 3. The spectrum of the precursors shows the O-H stretching of residual water over the range of 2,900-3,700 cm-1[8]. The result is in agreement with the weight loss of the TGA of the precursors which show the dehydration of water in the first region. The asymmetric and symmetric COO stretching of the carboxylate group linked with metal ions are at 1,610 and 1,360 cm-1 [8], respectively. The absence of free carboxyl shows that all carboxyl groups from carboxylic acid are involved in the coordination.
|
|
|
Figure 3. FTIR spectra of the precursors and powder calcined at 650-800oC in air for 24 h.
|
The spectra of the powder calcined at 650-800°C show a severe reduction in the intensity of the O-H stretching. Carbonyl and carboxyl groups of organic compounds were not detected. The stretching and bending bands of CO32- were detected at 1,410-1,510 cm-1 and 880 cm-1[8], respectively. The concentration of CO32- is decreased with an increase in the calcination temperature. No CO32- was detected at 800°C calcination. According to the calcination process, nickel-oxygen bands were clearly detected at 400-600 cm-1[9].
Phase Analysis
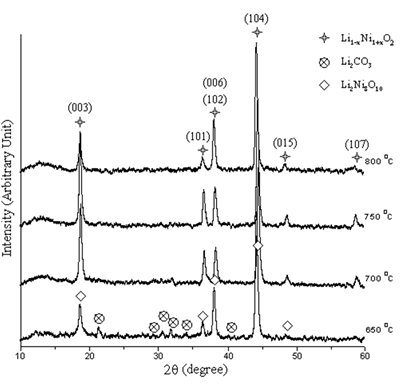
The XRD peaks of the powder calcined at 650-800oC in air for 24 h are shown in Figure 4. At 650 and 700oC, the powder is Li1-xNi1+xO2 ( 0 ≤ x <1 ) [10-12] containing Li2Ni8O10 [13] and Li2CO3 [14] as impurities. The peaks of both non-stoichiometric and stoichiometric phases diffract from the same planes and are at the same 2θ but the intensities are different [10-13]. At 750 and 800oC, only Li1-xNi1+xO2 was detected. At 650oC, the peaks are broad showing that the powder is very fine grained. The powder becomes more crystalline with larger grain size at higher temperature.
|
|
|
Figure 4. XRD patterns of the powder calcined at 650-800oC in air for 24 h.
|
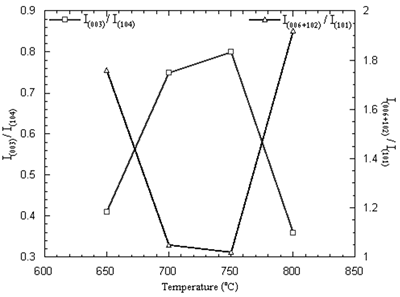
The purified Li1-xNi1+xO2 with small lithium deficiency is the requirement. The optimum condition for preparation of lithium nickel oxide is identified by the intensity ratios I(003)/I(104) and I(006+102)/I (101) of the XRD patterns [4, 7, 15, 16]. The intensity ratios of the powder are shown in Figure 5. The maximum I(003)/I(104) and minimum I(006+102)/I (101) ratios are the parameters to determine the best performance of the oxide [4, 7, 15, 16]. The maximum and minimum intensity ratios obtained from the powder calcined at 650-800oC in air for 24 h are at the temperature of 750oC.
|
|
|
Figure 5. Intensity ratios of Li1-xNi1+xO2 powder calcined at 650-800oC in air for 24 h.
|
The maximum intensity ratio corresponds to the most ordering of lithium and nickel ions. Cations residing in their normal lattice sites will promote the diffusion of charge carriers resulting in good electrochemical performance such as the rechargeable capacity and reversibility for the electrochemical reaction [4]. The minimum intensity ratio corresponds to the best hexagonal ordering [15-17] which is the key factor to promote the electrochemical performance as well.
Possible Mechanism of Formation
During calcination, the precursors decompose several steps by the equations:
|
Precursor → Li1-xNi1+xO2(s) + Li2Ni8O10(s) + Li2CO3(s)
|
(1)
|
|
(1-x) Li2Ni8O10(s) → 2 Li1-xNi1+xO2(s) + (6 –10x) NiO(s)
|
(2)
|
|
Li2CO3(s) → Li2O(g) + CO2(g)
|
(3)
|
NiO(s) perfect lattice obtained from equation (2) interacts with oxygen in the ambient atmosphere leads to NiO(s) imperfect lattice containing negatively charged vacancies and electron holes [18]. The oxygen in the ambient atmosphere adsorbs on NiO(s) perfect lattice. The adsorbed oxygen chemisorbs by attracting an electron from Ni2+ and Ni3+ or electron hole forms. The chemisorbed oxygen is fully ionized to form O2- and another hole forms. At the same time, Ni2+ from the normal lattice diffuses towards the surface of the NiO(s) crystal to associate with the fully ionized oxygen ion and negatively charged vacancy forms inside the crystal. Nickel and oxygen ions occupy their normal lattices on the surface of the crystal. Li+ ions (see equation (3)) fill into the negatively charged vacancies and electron holes associated with Ni2+ to form Ni3+. Every Li+ entering the structure, one Ni2+ is oxidized to Ni3+. The presence of Li+ stabilizes an equivalent number of Ni3+ or electron hole in the crystal. Due to the concentration gradient, the fluxes of Li+ and Ni3+ ions are established. Li+ and Ni3+ ions are arranged in order and the hexagonal structure of Li1-xNi1+xO2 finally forms [7, 17, 19, 20]. NiO molecules in equation (2) are nascent and all of them were transformed to Li1-xNi1+xO2. The chemical reaction can be written as
2(1+x) NiO(s) + (1-x) Li2O(g) + 0.5(1-x) O2(g) → 2 Li1-xNi1+xO2(s) (4)
Mean Oxidation State of Nickel
The total content of nickel (Ni3+ + Ni2+) and Ni3+ was determined using AAS and a titration. Ni3+ was reduced to Ni2+ with excess ammonium iron (II) sulfate and back titrated with potassium permanganate. Mean oxidation state of nickel in Li1-xNi1+ xO2 was calculated using the equation
Mean oxidation state = 2 + N (5)
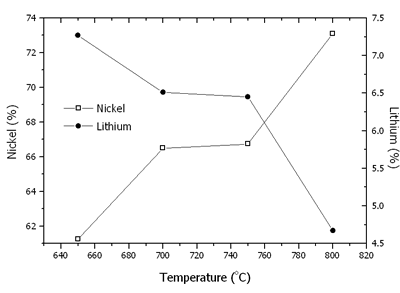
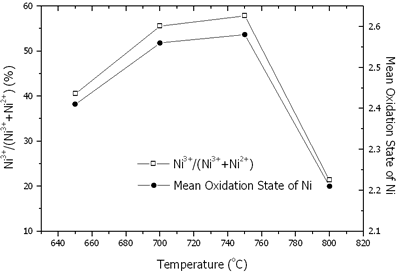
Where N is the mole fraction of Ni3+ in the total mole of nickel. The contents of nickel, lithium, Ni3+/(Ni3+ + Ni2+) and mean oxidation state of nickel are shown in Figures 6 and 7. At 650-800oC, there were the existence of both Ni2+ and Ni3+. The content of nickel was increased with an increase in the temperature due to the evaporation process of Li2O. The rate of lithium evaporation was increased with an increase in the temperature resulting in deterioration of the electrochemical performance of the crystal [15, 16]. At 650-750oC, Ni3+ was increased due to the oxidation of Ni2+ in Li2Ni8O10 as previously explained. The reduction process was established as well. The oxidation process was dominant; therefore, Ni3+ was increased to the maximum value at 750oC. At 800oC, Li+ evaporated very rapidly along with the reduction of Ni3+ to Ni2+. Then, the Ni3+ content rapidly decreased.
|
|
|
Figure 6. Contents of nickel and lithium in Li1-xNi1+xO2 powder calcined at 650-800oC in air for 24 h.
|
|
|
|
Figure 7. Content of Ni3+/(Ni3+ + Ni2+) and mean oxidation state of nickel in Li1-xNi1+xO2 powder calcined at 650-800oC in air for 24 h.
|
Mean oxidation state of nickel in the powder calcined at 650-800oC in air for 24 h is the maximum at 750oC. It shows the correspondence of mean oxidation state of nickel, the maximum Ni3+ content and the optimum intensity ratios at the same temperature of 750oC.
Optimum Temperature and Time
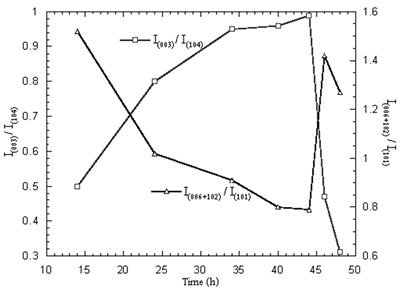
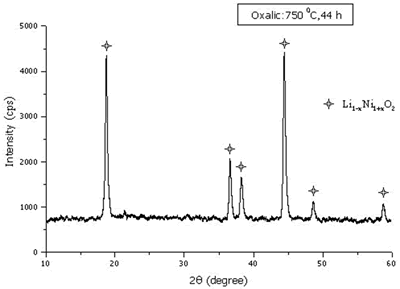
When the 750 oC calcination was kept constant and the time was varied between 14 and 48 h, the maximum and minimum intensity ratios are shown in Figure 8. The optimum time for the calcination is 44 h. At the optimum temperature and time, the Ni3+ content and mean oxidation state of nickel are 68.33 % and 2.68, respectively. The XRD pattern of the powder calcined at the optimum temperature and time is shown in Figure 9 and consisted of Li1-xNi1+xO2 single phase.
|
|
|
Figure 8. Intensity ratios of Li1-xNi1+xO2 powder calcined at 750oC in air for 14-48 h.
|
|
|
|
Figure 9. XRD pattern of the powder calcined at the optimum temperature and time.
|
External Morphology
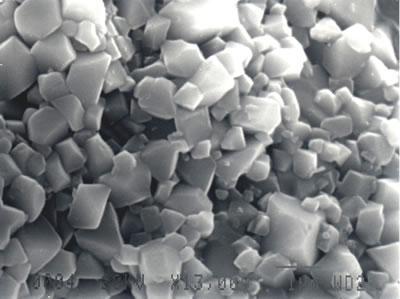
The external morphology of Li1-xNi1+xO2 powder calcined at the optimum condition was observed using SEM as shown in Figure 10. The powder consists of 0.3-2 μm facet grains which show good crystalline and sharp peaks on the XRD pattern.
|
|
|
Figure 10. SEM micrograph of Li1-xNi1+xO2 powder calcined at the optimum temperature and time.
|
Conclusions
Li1-xNi1+xO2 powder was successfully prepared by the sol-gel method using oxalic acid as a chelating agent with the subsequent calcination at 650-800oC for 14-48 h. The formation mechanism of Li1-xNi1+xO2 is briefly explained as follows
Precursor → Li1-xNi1+xO2(s) + Li2Ni8O10(s) + Li2CO3(s)
(1-x) Li2Ni8O10(s) → 2 Li1-xNi1+xO2(s) + (6 –10x) NiO(s)
Li2CO3(s) → Li2O(g) + CO2(g)
2(1+x) NiO(s) + (1-x) Li2O(g) + 0.5(1-x) O2(g) → 2 Li1-xNi1+xO2(s)
The XRD patterns showed the single phase of lithium nickel oxide at 750 and 800oC calcination. The maximum I(003)/I(104) and minimum I(006+102)/I (101) intensity ratios, the maximum Ni3+ content and the maximum oxidation state of nickel are existent at the same temperature of 750oC. The best condition for preparation the powder is 750oC for 44 h.
References
1. H. Arai, S. Okada, H. Ohtsuka, M. Ichimura and J. Yamaki, “Characterization and Cathode Performance of Li1-xNi1+xO2 Prepared with the Excess Lithium Method”, Solid State Ion., 80 (1995) 261-269.
2. M.Y. Song and R. Lee, “Synthesis by Sol-gel Method and Electrochemical Properties of LiNiO2 Cathode Material for Lithium Secondary Battery”, J. Power Sources, 111 (2002) 97-103.
3. H. Arai, S. Okada, Y. Sakurai and J. Yamaki, “Thermal Behavior of Li1-yNiO2 and the Decomposition Mechanism”, Solid State Ion., 109 (1998) 295-302.
4. Y.M. Choi, S.I. Pyun, S.I. Moon and Y.E. Hyung, “A Study of the Electrochemical Lithium Intercalation Behavior of Porous LiNiO2 Electrodes Prepared by Solid-state Reaction and Sol-gel Methods”, J. Power Sources, 72 (1998) 83-90.
5. Y.K. Sun, “Synthesis and Electrochemical Studies of Spinel Li1.03Mn2O4 Cathode Materials Prepared by a Sol-gel Method for Lithium Secondary Batteries”, Solid State Ion., 100 (1997) 115-125.
6. T. Tsumura, S. Kishi, H. Konno, A. Shimizu and M. Inagaki, “Structure and Thermal Decomposition of Lithium-manganese Dicarboxylate Systems”, Thermochim. Acta, 278 (1996) 135-144.
7. Y.S. Lee, Y.K. Sun and K.S. Nahm, “Synthesis and Characterization of LiNiO2 Cathode Material Prepared by an Adiphic Acid-assisted Sol-gel Method for Lithium Secondary Batteries”, Solid State Ion., 118 (1999) 159-168.
8. B. Smith, “Infrared Spectral Interpretation”, CRC Press, N.Y., (1999) 243-249.
9. S. Castro-Garcia, C. Julien and M.A. Senaris-Rodriguez, “Structural and Electrochemical Properties of Li-Ni-Co Oxides Synthesized by Wet Chemistry via a Succinic-acid-assisted Technique”, Internat. J. Inorg. Mater., 3 (2001) 323-329.
10. W. Li, J. N. Reimers and J. R. Dahn, “Crystal Structure of LixNi2-xO2 and a Lattice-gas Model for the Order-disorder Transition”, Phys. Rev. B, 46 (1992) 3236-3246.
11. M. M. Rao, C. Liebenow, M. Jayalakshmi, H. Wulff, U. Guth and F. Scholz, “High-temperature Combustion Synthesis and Electrochemical Characterization of LiNiO2, LiCoO2 and LiMn2O4 for Lithium-ion Secondary Batteries”, J. Solid State Electrochem., 5 (2001) 348-354.
12. M. R. Palacin, D. Larcher, A. Audemer, N. Sac-Epee, G.G. Amatucci and J. M. Tarascon, “Low-temperature Synthesis of LiNiO2, Reaction Mechanism, Stability and Electrochemical Properties”, J. Electrochem. Soc., 144 (1997) 4226-4236.
13. J. D. Hanawalt, “1985 Powder Diffraction File, Inorganic Phases, Search Manual”, JCPDS International Centre for Diffraction Data, PA 19081, U.S.A., (1985).
14. S.P. Lin, K.Z. Fung, Y.M. Hon and M.H. Hon, “Crystallization Mechanism of LiNiO2 Synthesized by Pechini Method”, J. Crystal Growth, 226 (2001) 148-157.
15. B. J Hwang, R. Santhanam and C.H. Chen, “Effect of Synthesis Conditions on Electrochemical Properties of LiNi1-yCoyO2 Cathode for Lithium Rechargeable Batteries”, J. Power Sources, 5059 (2002) 1-9.
16. G. T. K. Fey, V. Subramanian and J. G. Chen, “Synthesis of Non-stoichiometric Lithium Nickel Cobalt Oxides and Their Structural and Electrochemical Characterization”, Electrochem. Commun., 3 (2001) 234-238.
17. J. N. Reimers, E. Rossen, C.D. Jones and J.R. Dahn, “Structure and Electrochemistry of LixFeyNi1-yO2”, Solid State Ion., 61 (1993) 335-344.
18. N. Birks and G.H. Meier, “Introduction to High Temperature Oxidation of Metals, Edward Arnold”, London, (1983) 38-40.
19. S.P. Lin, K.Z. Fung, Y.M. Hon and M.H. Hon, “Crystallization Kinetics and Mechanism of the LixNi2-xO2 (0 < x ≤ 1) from Li2CO3 and NiO”, J. Crystal Growth, 234 (2002) 176-183.
20. V. Bianchi, D. Caurant, N. Baffier, C. Belhomme, E. Chappel, G. Chouteau, S. Bach, J.P. Pereira-Ramos, A. Sulpice and P.Wilmann, “Synthesis, Structural Characterization and Magnetic Properties of Quasistoichiometric LiNiO2”, Solid State Ion., 140 (2001) 1-17.
Contact Details
|