During any pharmaceutical product development, the preliminary process is to identify active drug substances. The aim of the formulation development is to include this substance in a product and devise a production technique that can deliver that product safely and reliably.
In Quality by Design (QbD) terms, this largely depends on identifying the aspects that define the product’s clinical efficacy, and then learning to regulate the process and material attributes, which will assure consistent delivery to the ensuing quality target performance profile (QTPP).
This article examines the techniques and stages involved in transitioning from a drug substance to an oral solid dosage (OSD) form; it also explores the analytical technologies that can be useful in such processes, and specifically focuses on collecting the required data to advance pharmaceutical development within the context of the application of QbD and the regulatory requirements.
The Regulatory Framework and QbD
ICH Q8(R2) offers thorough guidance regarding the pharmaceutical product formulation and proposes that the subsequent steps constitute a minimal requirement for success:
- Classifying the quality target product profile (QTPP)
- Identifying the product’s critical quality attributes (CQAs)
- Establishing the CQAs of the excipients and drug substance
- Choosing a suitable manufacturing process
- Defining a control strategy
QbD revolves around these steps and influences the approach and thoroughness that are used when tackling them. Although there is no regulatory requirement to execute QbD as part of a new drug application (NDA) or investigational new drug (IND) submission, there are possible rewards. Drug manufacturers who use this approach are allowed to change the operating conditions within the defined design space. By meeting the regulators’ requirement to reduce risk, such submissions undergo a lighter regulatory focus when compared to those where comprehensive process and product knowledge is not clearly shown.
The basic steps involved in pharmaceutical product formulation are similar with or without QbD. Focusing on the data necessary to drive these steps can help in identifying analytical strategies, which can support the development work.
Characterizing the Drug Substance
During the preliminary stages of formulation, focus is given to the drug substance itself and how to render its healing effect to the patient. This approach helps in defining the QTPP. This article focuses on OSD forms. The pharmacological profile of a drug substance can be affected by physicochemical and biological properties. A better knowledge regarding the effect of these properties would help in developing a comprehensive specification for the drug substance, as well as other parameters of the QTPP, such as the amount of drug substance present in individual tablets. ICH Q6A is useful in identifying which particular tests are needed to characterize the drug substance in a NDA or IND situation and proposes that the specifications for the drug substance may relate to:
- Particle size
- Water content
- Chiral identity
- Physical properties such as melting point, pH, refractive index
- Polymorphic form/amorphous content
- Microbial content
- Inorganic impurity levels
Most of these properties can affect the product’s performance in several ways, and hence are identified as CQAs for the drug. For instance, the size of the particle can impact the bioavailability, solubility, or dissolution of the drug in a tablet, and can also affect the processability of a tablet blend. When compared to coarser particles, finer ones may flow less easily. A blend containing a non-uniform-sized drug and excipient particles is subject to separation and thus results in poor content uniformity.
Case Study: Using MDRS to Differentiate Drug Substance Polymorphs
In the morphologically directed raman spectroscopy (MDRS) technique, morphological data is used to guide the efficient application of Raman spectroscopy, which enables chemical identification. This method is executed by using an automated imaging system equipped with spectroscopy capabilities, such as the Morphologi G3-ID from Malvern Panalytical. Figure 1 illustrates two entirely different polymorphic forms of a drug substance, determined using a Morphologi G3-ID.
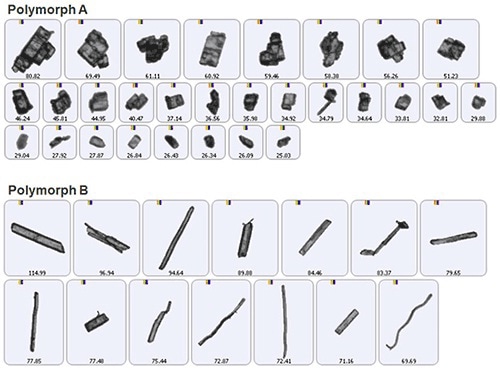
Figure 1. Automated imaging is an efficient technique for differentiating polymorphs of a drug substance.
Automated imaging can collect thousands of particle images within a matter of minutes and provides consistent differentiation between the two polymorphs. However, the sample images represent a small population of particles that might be less securely defined on the basis of shape and size alone.
Figure 2 shows the Raman spectra for polymorph A and B. For The spectra are very similar and superimpose one another. However, clear differences can be seen within the 1120 – 1300 cm-1 region.
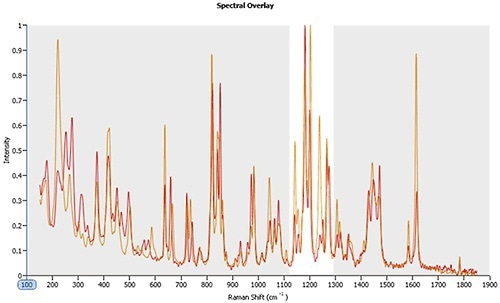
Figure 2. Raman spectra for polymorphs A (orange line) and B (red line). Between 1120 – 1300 cm-1 the spectra are clearly different enabling the reliable classification of particles that are closely similar in morphological form.
This spectroscopic data can be utilized to confirm the data produced with automated imaging and can even offer further information regarding the polymorphs’ crystal structure, which can be used to clarify and control formation mechanisms.
Excipients
After a complete profile of the drug substance has been developed, the subsequent step is to identify the excipients which are needed to develop the drug substance within a tablet. The case studies given below show how laser diffraction particle size analysis, and gel permeation chromatography/size exclusion chromatography (GPC/SEC), can be useful in locating a suitable excipient and grade.
Case Study: Selecting an Excipient for Controlled Drug Release
Hypromellose (Hydroxypropyl Methylcellulose, HPMC), and its derivatives, are polymers that are often utilized as controlled drug release agents. The grade of the polymer impacts the release profile of the drug substance, making it a CQA. GPC/SEC is a two-step process. In the first step, a polymeric sample solution is separated on the basis of hydrodynamic volume using a packed column. The second step involves the examination of the ensuing size fractionated eluent stream through one or more detectors.
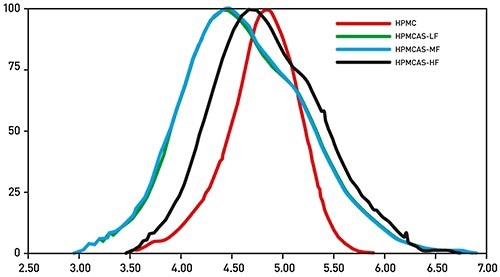
Figure 3. Triple detector GPC/SEC reliably and directly measures the absolute MW of polymeric excipients for controlled release, providing data that supports identification of a suitable candidate for the any specific formulation.
Figure 3 displays the MW distribution data for four samples of HPMC and the derivative excipient Hypromellose acetate succinate (HPMCAS) determined with Malvern Panalytical’s triple detector GPC/SEC system, Viscotek TDAMax. These results show the significant and variable inaccuracies which can result by relying on calibration of the system with a standard. The use of a light scattering detector removes these errors and gives precise measurements of absolute MW that can be employed to distinguish the excipients, and grade their relative performance. In addition, triple detection provides intrinsic viscosity and molecular size data which can be used to measure critical structural aspects of a polymer.
Case Study: Selecting Excipient Grade
Laser diffraction is a particle sizing method that is capable of measuring the size of particles either dry or wet samples comprising particles in the size range between 0.01 and 3500 µm. Figure 4 shows how laser diffraction is used to determine the particle size distribution of varied lactose blends. Malvern Panalytical’s Mastersizer 3000 was used to measure these data. This instrument spans the particle size range required to determine both fine and coarse materials, and also provides the resolution required to accurately measure the proportion of fine materials present.
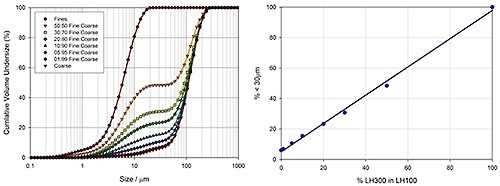
Figure 4. Particle size distribution data highlights the ability of laser diffraction to precisely determine the amount of fines in lactose grades containing coarse and fine material.
Case Study: Monitoring Process Induced Changes in an API
A study was performed to evaluate the effect of processing on the size and shape of a drug substance within a tablet blend. The aim was to find out whether blending results in break-up of particles. To that end, data were acquired for blending the drug substance with three types of excipients such as microcrystalline cellulose (MCC), lactose, and a combination MCC and lactose. MDRS technique was utilized to determine the morphology of the drug substance within the tablet blends, before and after the blending step.
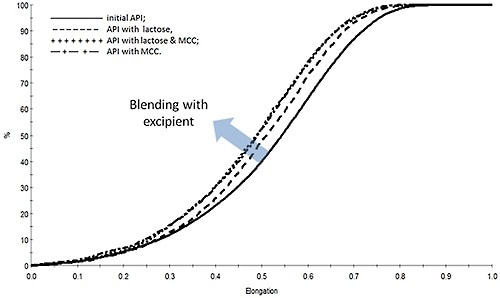
Figure 5. Measurements of the particle shape of the drug substance reveal that blending results in a reduction in elongation that is suggestive of particle chipping.
Figure 5 illustrates how the elongation of the drug substance particles changes on account of blending.
Case Study: Monitoring the Evolution of Particle Size during Wet Granulation
High shear wet granulation provides several benefits when compared to alternative granulation techniques and is normally considered for tablet manufacture. In-line particle sizing probes, such as Malvern Panalytical’s Parsum IPP70 employs spatial partial velocimetry to determine the size of the particle in real-time, and have proven applications such as PAT for granulation monitoring. These probes allow reliable and continuous particle size measurement in the moist environment of the granulator.
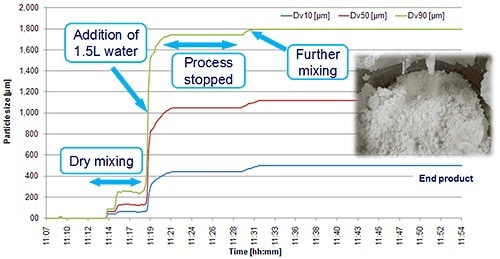
Figure 6. An in-line particle sizing probe allows real-time continuous monitoring of a wet granulation process.
Figure 6 depicts the development of granule size during a high shear wet granulation process, determined by means of an in-line Parsum probe.
Case Study: Optimizing Spray Coating
Water-based suspensions or solutions that include a suitable polymeric excipient are utilized to impart a final coating to a tablet. The quality of the final coating largely depends on the droplet size of the sprayed coating which affects finish, coating uniformity, and transfer efficiency (TE). Therefore, it is important to optimize and control the droplet size during the spray coating process. Figure 7 demonstrates how the particle size distribution of droplets of a spray coating solution differs as a virtue of distance from the spray nozzle.
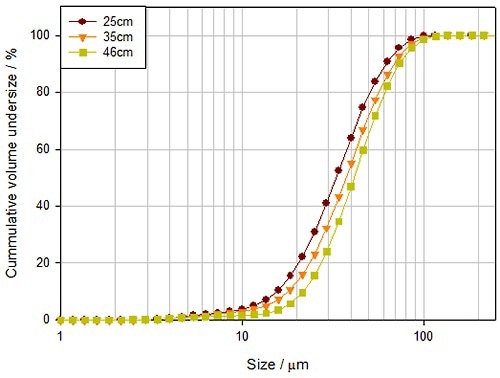
Figure 7. The distance between the tablet and the spray nozzle impacts the delivered droplet size, and consequently the quality of the applied coating.
Conclusion
Over the past few years, formulation has become a systematic process. In order to realize successful formulation, a better understanding of the behavior of individual components in a drug product is required. This way, constituent elements can be merged together to meet pharmacological targets, both at the laboratory and commercial scale. The extensive use of QbD strengthens this trend and intensifies the need for analytical methods, which can provide the required data in an efficient and timely manner. This article shows how automated imaging, laser diffraction particle size analysis, GPC/SEC, and MDRS techniques can be used within the current formulation practice to move pharmaceutical product formulation to full-scale production.

This information has been sourced, reviewed and adapted from materials provided by Malvern Panalytical.
For more information on this source, please visit Malvern Panalytical.