Functional correlation is considered to be a main objective in surface metrology research, and is referred to the associations between surfaces and the phenomena, which affect or are affected by their topography. Particularly in mechanical and manufacturing engineering (ASME B46.1, 2009), surface topography is known as texture, and it is often called roughness. There are two types of functional correlations:
- The first (correlations of the "first kind") are between processing phenomena that altered or produced the surface and its topography.
- The second or (correlations of the "second kind") are between the surface performance/behavior and the topography.
Engineering design is supported by both of these functional correlations, which are developed by surface analysis and measurement achieved through laser scanning confocal microscopy.
When it comes to the design of manufacturing processes, information about the first kind of functional correlation is very useful. Functional correlations of the first kind are applied to gain a better understanding of the type of ‘use-wear produced surfaces’ on archeological artifacts, to detect weapons in forensics studies and also to detect which types of foods produce dental micro-wear.
Functional correlations of the first kind can even be utilized to track and regulate deterioration in cultural heritage preservation, while the second type of functional correlation is helpful to design products. These functional correlations could be helpful to develop surface science and acquiring a better insight into biological and physical surfaces. For instance, this biological and physical surface analysis can help to develop bio-mimicry applied in manufacturing applications.
Many phenomena are currently available that tend to be topographically related, as opposed to the functional correlations specified in the literature. This is particularly true with regard to the second kind of functional correlation. A logical method to surface topography design for products as well as production processes used for developing these products can be respectively based on functional correlations of the first and second kinds.
The level to which functional correlations are applied in both product and process design can be proprietary, and this cannot be accessed by the public. Nevertheless, quantitative functional correlations can be established through proper characterization of the topography being considered.
Topography characterization has two aspects that are imperative to find out the functional correlations, in addition to having a good measurement. These aspects include the geometric nature of the characterization and the extent of the characterization. Also, proper characterization of quantified surfaces relies on performing measurements at the proper scale. Topographically associated phenomena on rough surfaces (functional correlations) are collectively produced by interactions. These interactions take place at certain scales of interaction, which have to be considered in the measurement scales to discover the functional correlations (Figure 1).
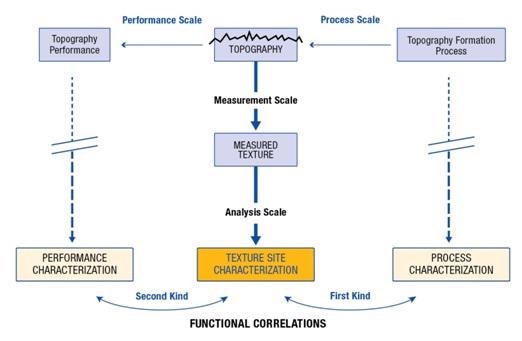
Figure 1. The importance of scales in determining functional correlations of the first and second kinds.
Methodology
A much more simple correlation of the first kind is provided by machining, with an experimental and hypothetical basis that could also give a clear example of the transition between irregular, or rough and smooth topographies. This is rendered by the association between feed per revolution (f) in traditional machining by rotating the peak-to-valley roughness (Rt or Rz) and the tool nose radius (r). The former refers to the variation between the highest and lowest measured heights on a given surface. This relation is shown as:
Rt ≈ f2 /8r
This equation is developed based on the tool (r)’s spherical nose, scraping out an arc-shaped groove in the surface and creating a helix around a cylindrical work piece, as illustrated in cross-section in Figure 2. When these arcs are observed in cross-section, they possess the highest cord length equivalent to the feed (f).
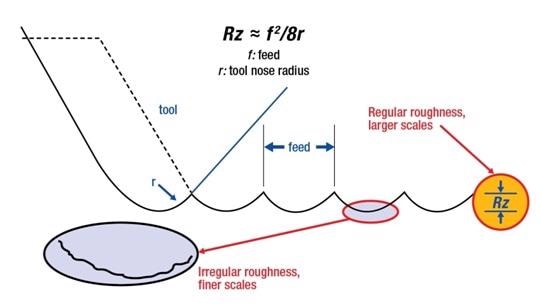
Figure 2. Modeling turned surface roughness for a correlation of the first kind at the scale of the feed and tool nose radius.
Figure 3 shows an image, which was obtained from a measurement of a turned surface. The surface was rotated using a tool with a nose radius of 400 µm and at a feed of 150 µm for each revolution. An Evident LEXT OLS4000 laser scanning confocal microscope equipped with a 50x objective was used to make the measurement. Inside this image, the large-scale grooves from the shape of the tool nose can be seen clearly. Also seen is the usual peak-to-valley roughness illustrated by Equation 1.
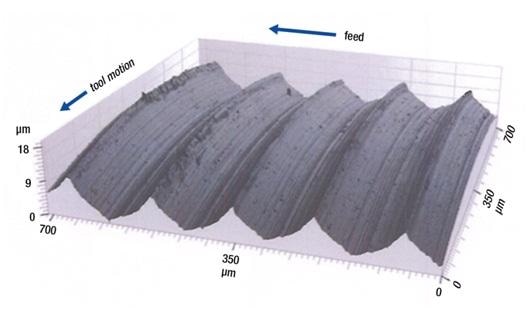
Figure 3. Image of a surface turned with a feed of 150 µm and a tool nose radius of 400 µm (rendered from a measurement made with an Evident LEXT OLS4000 laser scanning confocal microscope).
Additionally, there are some details of an irregular roughness at the fine scales which are not recorded by the peak-to-valley roughness illustrated by Equation 1. At the experimental level, roughness can be associated with the feed with R2 higher than 0.95. Equation 1 will apply at fine scales, provided that the irregular roughness within the groove left by the nose of the tool is less than the roughness illustrated by the equation. Likewise, at large feeds, the equation is applicable as long as the feed is less than the cord illustrating the limitations of the round part of the tool nose.
A functional correlation of the first kind is shown in Figure 4. The feed for each revolution is reverted with the peak-to-valley roughness in turning. Clear deviation between the actual and hypothetical roughness can be seen as the space between the two curves. Rt of approximately 1.5 µm seems to be the minimum roughness that could be obtained, with the groove’s irregular roughness likely to dominate.
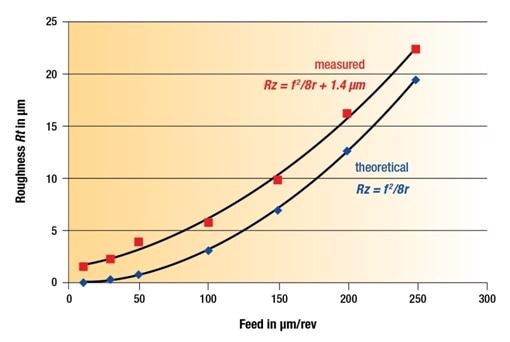
Figure 4. A first-kind functional correlation showing theoretical and measured peak-to-valley roughness (Rz).
However, when Rt and Equation 1 are applied to characterize the topography of the turned surface, they are not able to capture the characteristics of topography at finer scales.
This aspect can be a major oversight, because at these scales phenomena tend to interact with the topography and affect the surface performance. While functional correlations of the second kind can be applied in a product design, they may not be obtained by using only the Rt alone as the parameter for roughness characterization.
Phenomena that depend on topography like adhesion and reflectivity are likely to rely on the finer scale, that is, irregular roughness within the more regular grooves left by the nose of the tool.
Examples of Functional Correlations
Relating fatigue limit to roughness curvature, roughness to sheet metal friction, and substrate roughness to adhesive strength of thermal spray coatings are examples of functional correlations of the second kind that were experimentally discovered. Hypothetical support for these functional correlations correlates the mechanisms of interaction with the rough surface, which in turn affects the performance related to the topographic characterization parameters. If the right scale range is detected, different forms of topographic characterization parameters have been shown to correlate with friction.

This information has been sourced, reviewed and adapted from materials provided by Evident Corporation - Industrial Microscopy.
For more information on this source, please visit Evident Corporation - Industrial Microscopy