Raman technology has proven to be a suitable tool for identification and verification of raw materials due to its rapid speed and convenience. It is possible to perform Raman measurements through transparent containers, without any need for sample preparation.

Figure 1. NanoRam in action for raw material identification
This article describes the NanoRam handheld Raman spectrometer that has been specifically developed to detect raw materials through various polyethylene (PE) bags. A Whirl-Pak 4oz bag (PE bag) with a thickness of 2.25 mil (~0.06 mm) was used in this analysis.
For testing purposes, a pharmaceutical active ingredient (API) in the form of powder was taken from three different lots. Tests were conducted via 9 PE bags, 5 PE bags, and a single layer PE bag.
Experiment
The following methods were generated:
- Method “9PE” using material from lot#2 in 9 layers of PE bags
- Method “5PE” using material from lot#1 in 5 layers of PE bags
Using the same API material, each method was generated with 20 scans. “5PE” and“9PE” methods were respectively created using a sample from lot #1 in 5 layers of PE bags and using a sample from lot#2 in 9 layers of PE bags. However, no method was generated for the single layer PE bag sample.
Next, identification tests were carried out with materials from lot#1, lot#2, and lot#3 in 9 layers of bags, 5 layers of bags, and 1 layer PE bag against both methods. For all of these tests, a point-and-shoot sampling adaptor was employed. Materials from different lots were applied to the test to ensure that material identification results are not negatively affected by normal lot-to-lot difference, if present.
Test Result and Discussions
A multivariate analysis approach was employed in the NanoRam handheld Raman spectrometer. This method is built on principal component analysis (PCA) models meant for materials classification. Multivariate analysis uses at least 20 Raman spectral scans, and can be developed to accommodate potential material variations within itself, from various vendors, or related to uniformity of materials, for example uniformity from various batches and lots.
The “Fail” or “Pass” test results are based on a quantified p-value on a confidence level of 95%. The result is “Pass” when p-value is = 0.05, which means the sample cannot be barred from the acceptance space determined by the 20 scans of the method and that the sample could well be the material denoted by the method.
The result is “Fail” when the p-value is below 0.05, which means that the quantified sample is not the material denoted by the method. Table 1 summarizes the test results. “Pass” results were acquired for all identification tests using the methods “9PE” and “5PE” for samples through various layers of bags as well as from different lots.
Table 1. The “Pass” or “Fail” test results
| Method |
Raw Materials |
| Lot#1 in 1 layer PE bag |
Lot#1 in 5 layers PE bags |
Lot#1 in 9 layers PE bags |
Lot#2 in 5 layers PE bags |
Lot#2 in 9 layers PE bags |
Lot#3 in 5 layers PE bags |
Lot#3 in 9 layers PE bags |
5PE
(Lot#1) |
Pass
p = 0.4689 |
Pass
p = 0.9945 |
Pass
p = 0.6257 |
Pass
p = 0.9717 |
* |
Pass
p = 0.9733 |
* |
9PE
(Lot#2) |
Pass
p = 0.3436 |
Pass
p = 0.5270 |
Pass
p = 0.9997 |
* |
Pass
p = 0.8282 |
* |
Pass
p = 0.9749 |
* Experiments were not conducted as full factorial because of the comparable results shown among the three lots.
Figure 2 displays the overlay of the Raman spectra acquired for the API material in 9 layers, 5 layers, and 1 layer of PE bags, as well as the PE bag spectrum.
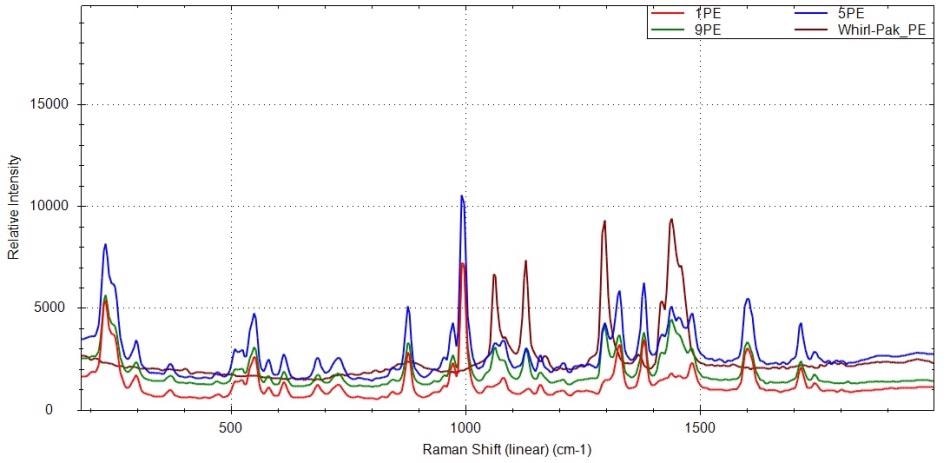
Figure 2. Spectra overlay of API material in 1 layer-, 5 layer-, 9-layer PE bags, along with spectrum of the PE bag
The PE material exhibits a number of major Raman peaks in the regions highlighted by the rectangular boxes. In Figure 2, it can be seen that as the PE bag becomes thicker with more and more layers, the PE material’s Raman signatures become more prominent, as observed with the PE peaks demonstrated in the spectrum for material in 9 layers PE bags.
However, as the PE material becomes thicker with more layers, the API material’s Raman signatures become less prominent, as demonstrated by the API peaks in the spectrum for material in 9 layers PE bags.
Conversely, due to the algorithm required for building the PCA model using 20 scans in the NanoRam, the method created on the NanoRam handheld Raman spectrometer is strong enough that the method created via multiple layers of PE bags can consistently detect samples via several layers of PE bags.
The PE material becomes thicker with increasing layers of PE bags. The API material’s Raman signatures become less prominent, whereas the hindrance from the PE material will largely impact the result.
While 9 layers were the maximum tested, there will be restrictions regarding the layers of bags that can be applied. It is important to establish the relevant number of layers through a method validation process, where the method is substantiated through negative tests, positive tests, as well as robustness tests.
Conclusion
The NanoRam handheld Raman spectrometer is capable of testing materials via several layers of transparent plastic bags. The number of PE bags, differing from 1 to 9 layers, provided “Pass” results for the materials within the bag, indicating minimum impact of the PE bags on the material detection result.
The method created from the NanoRam spectrometer can be strong enough that the method created via several layers of PE bags can consistently detect samples through different or equal numbers of layers of PE bags.

This information has been sourced, reviewed and adapted from materials provided by B&W Tek.
For more information on this source, please visit B&W Tek.