Martensitic steels are developed to improve hardness and toughness, but the formation of highly-deformed martensite laths through quenching austenitic steel can result in major challenges for microstructural characterization using EBSD.
Martensite comprises of supersaturated carbon, distorting the crystal lattice away from body centered cubic and resulting in a high density of dislocations, the main cause of strengthening of the steel. Besides the lattice distortion, the laths are typically extremely small (< 1 µm), necessitating EBSD analysis using higher diffraction pattern resolutions and lower beam energies in order to obtain high indexing hit rates.
This article explains how the combination of speed and sensitivity of the CMOS-based Symmetry detector, coupled with the fact that high speeds can also be achieved with good pattern resolution, allows effective and fast characterization of a martensitic stainless steel sample.
Methodology and Results
A sample of untempered martensitic stainless steel was polished down to a final stage using colloidal silica, and subsequently analyzed in a field emission gun SEM. The beam accelerating voltage was first kept relatively low, at 12 kV, so as to minimize the EBSD pattern source volume and thus maximize the pattern quality, allowing a high indexing hit rate of ~ 90%. Patterns were obtained at a resolution of 311 x 256 pixels, with an exposure time of 2 ms offering a final acquisition speed of 495 pps. The initial analysis took 75 minutes, covering a 50 x 40 µm area with a measurement step size of 30 nm.
On the same sample, a second, considerably larger analysis was performed using a higher pattern resolution of 622 x 512 pixels and an accelerating voltage of 15 kV. Patterns were exposed for slightly longer, providing a final acquisition speed of 294 pps and a higher indexing hit rate of 96.5%. Using a 40 nm step size, an area of 150 x 115 µm was scanned. This took 10 hours in total (almost 11 million analysis points). In all analyses, the beam current was between 5 and 10 nA.
Figure 1a shows the results of the smaller first area. The pattern quality (band slope) map shows the difference in the sharpness of the Kikuchi bands: a few of the martensitic laths have relatively bright shades of gray, indicating sharper patterns connected with lower distortion in the crystal lattice. Yet, most of the laths have fairly low pattern quality and are significantly under 1 µm in width, bringing about challenges in successful EBSD analyses. The orientation map, shown in Figure 1b, clearly reveals the hierarchical nature of the martensitic structure, with the individual laths developing blocks, groups of blocks forming packets and, finally, groups of packets defining the prior-austenitic grains.
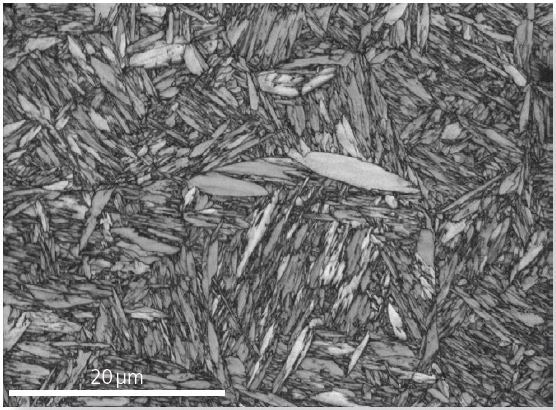
Figure 1a. Pattern quality map (band slope) of the first analysis area.
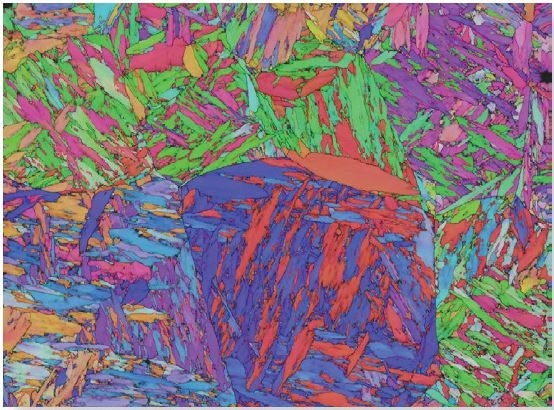
Figure 1b. Orientation map (IPF coloring scheme) of the first area
The area of the second analysis covers many more prior-austenitic grains, as shown in the pattern quality (band contrast) map in Figure 2a and the orientation map in Figure 2b. The first area analysis showed that prior-austenitic grains were typically ~ 20 µm diameter, but in the larger area analysis it is clear that some prior austenite grains are >100 µm diameter. For instance, it is possible to reconstruct the blue and red colored area at the top of Figure 2b (marked with “A”) into a single prior austenite grain. The pole figure from this grain (Figure 2c) shows the clear martensite variant selection from a single, original orientation.
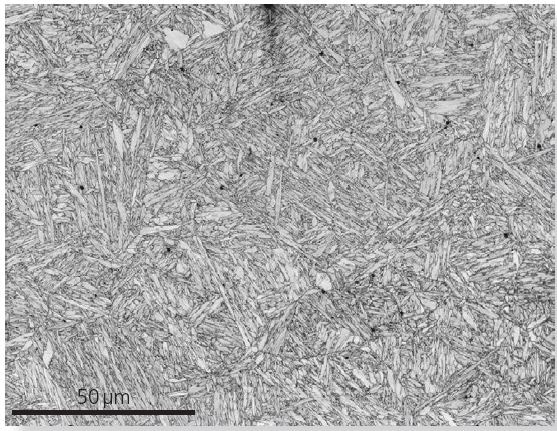
Figure 2a. Pattern quality map (band contrast) of the second area.
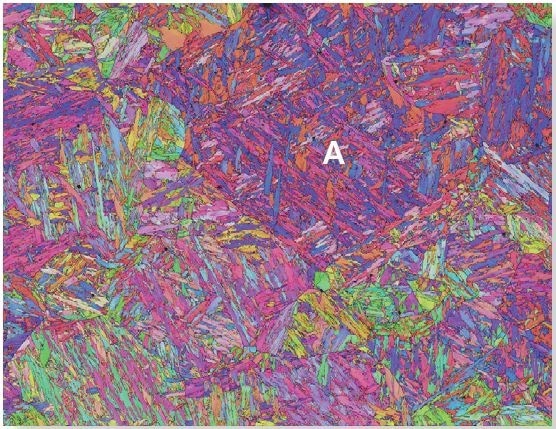
Figure 2b. Inverse pole figure orientation map of area 2. “A” marks a prior austenite grain analyzed in Figure 2c.
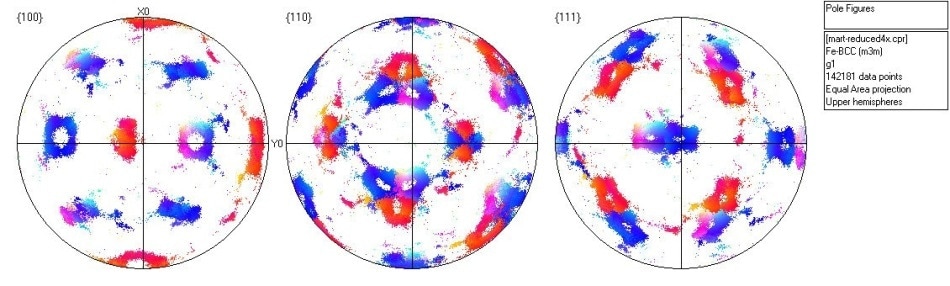
Figure 2c. {100}, {110} and {111} pole figures for the prior austenite grain marked “A” in Fig. 2b. The colors correspond to those in Figure 2b.
It is well documented (e.g. Kitahara et al., 2006) that many of the misorientations between martensite variants in adjacent laths satisfy coincident site lattice (CSL) relationships. This is depicted in Figure 3, wherein the proportion of all high angle boundaries in area 2 that are classed as CSL boundaries is plotted.
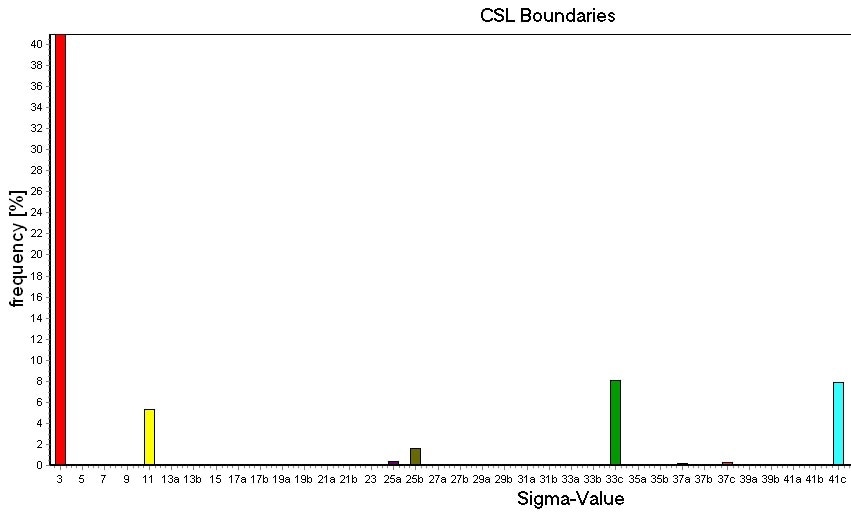
Figure 3. Histogram showing the proportion of high angle boundaries in area 2 that satisfy coincident site lattice (CSL) relationships. Note that >40 % of the boundaries can be classed as Σ3.
Conclusion
This article briefly shows the power of the Symmetry EBSD detector for effective analyses of complex materials samples at comparatively low accelerating voltages. The results from an untempered, martensitic stainless steel, obtained at acquisition rates of 290 – 500 pps, demonstrate that the sensitivity of the detector, combined with high pixel resolution diffraction patterns, allows relatively short analyses times as well as high indexing rates.
This indeed enables a detailed analysis of the martensitic variant selection as well as a characterization of the inter-lath boundaries from a relatively large area without the requirement for post-analysis reprocessing or pattern enhancement. This is the first time that the power of the EBSD technique for measuring martensitic structures has been so apparent.
Reference
H. Kitahara et al. (2006). Crystallographic features of lath martensite in low-carbon steel. Acta Materialia 54, 1279–1288

This information has been sourced, reviewed and adapted from materials provided by Oxford Instruments NanoAnalysis.
For more information on this source, please visit Oxford Instruments NanoAnalysis.