Nowadays, it seems almost primitive to share visual ideas and data through the use of bar graphs, static pie charts and the like. Now, we can deliver visuals which are dynamic and interactive, communicating insights quicker and more effectively in real time. Does it seem like the future of data visualization lies in virtual reality? The incredibly beautiful visualizations of the #MeToo movement from Google Trends and the Washington Post’s Sea of Steel visualization serve as excellent examples.
There is, however, one problem. There has been considerable growth in the amount of data coming in, even when only a small number of sources are involved. A great many tools, apps, and devices are now collecting data on a regular basis. There is an almost infinite stream of information as well as an endless stream of maintenance and revision for data visualizations.
There will soon be such limitations on 2D and even 3D images on flat surfaces – such as TVs or conventional monitors – that below-par visual experiences will result, at least in terms of data visualizations.
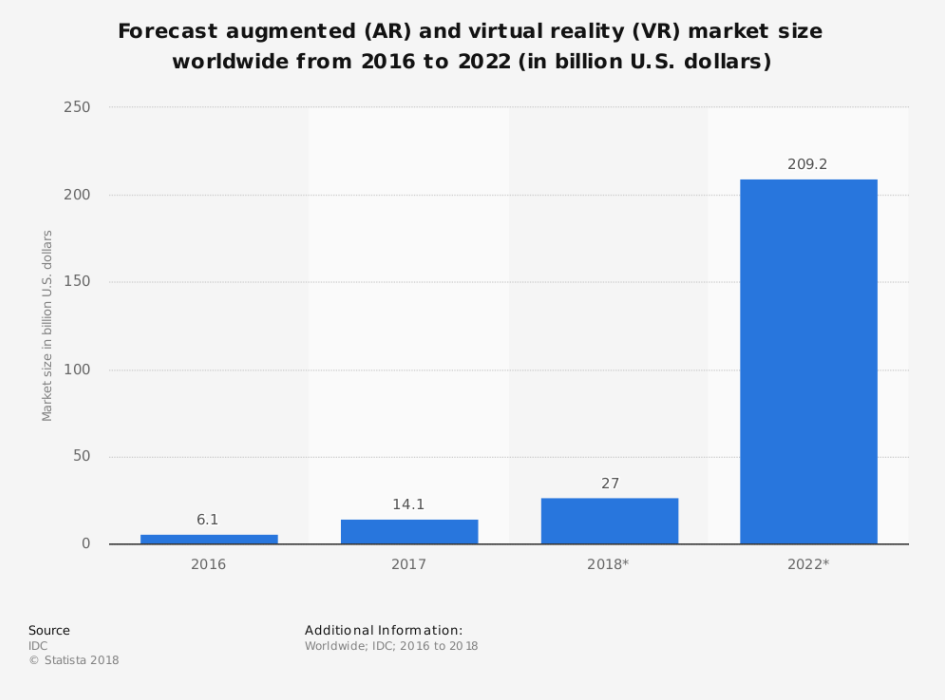
This is where virtual or augmented reality technologies come in. These are already so successful that experts have predicted the size of the global augmented virtual reality market will rise to a value of $209 billion by 2022. Likewise, the world market for virtual reality software is expected to be worth $6.4 billion by 2021, which is enormous.
There is also a great deal of potential for this technology to be used in the data visualization and analytics industry. Imagine an experience or virtual space in which you can manipulate, review and create data with 360-degree precision. The concept is particularly sci-fi and reminiscent of the Minority Report, and it could see anyone from average consumers to company executives reviewing data in a virtual space.
The way we view data will be completely altered by this. Take business presentations as an example. In these, executives or professionals gather in a conference-style environment, sitting around a table looking at a projector screen. This setting could completely change in virtual reality. For example, presentations could be delivered on alien planets or virtual beaches. It may sound far-fetched, but such settings can help the data visualizations and resulting presentation, particularly if the virtual environment is tailored to the existing content or topic.
Virtual Reality as the Future of Data Visualization: New Strategies
Naturally, data visualization isn't fun or entertaining. This can be a positive thing in more serious environments, however, it can also affect the data to convey. For example, audiences are less likely to pay attention or take in information if it is presented in a plain, conventional format.
In terms of experience, virtual reality can potentially offer a great deal more by way of interest and innovation. For example, look at Arwa Michelle Mboya’s Night at the Museum project (below). This provides a fantastic, mobile-friendly experience of virtual reality which is intended to display findings in numerous 3D-oriented scenes which you might be likely to see at a museum, science fair, or real world “gallery-like space”.
Data Viz in VR - 5 Demo Scenes
Excluding entertainment uses, VR and AR technologies are able to offer more practical uses in terms of data manipulation, processing, and review. Data can be presented in 3D canvas format, wrapping around the viewer visually in order to offer more natural and advanced ways of interacting with it. Discovery and pattern recognition can also be enabled by cross-referencing applications in more efficient ways.
These types of visual experiences are already being developed by Virtualitics, an AI and VR provider. When viewers are surrounded visually, it is called “immersive analytics”. Viewers are given total control along with access to smart mapping or AI support, which can be used to explore and understand data sets. This is about multi-dimensional data analysis, expanded by fantastically natural interactions and support.
Going Beyond Simple Experiences
At the moment, unfortunately, few applications offer data visualization which is VR-enabled. VR will require time and dedication from developers and software engineers in order to reach the height of its potential, as it is a relatively new concept.
Currently, shallow interactions are allowed by the majority of VR and AR data visualization experiences. Although you aren’t able to do much more than this, it is possible to move, reshape and view data in new forms. A fantastic example of this is DatavizVR. With this app, users are able to visualize and display data sets, although they can’t do anything else. This leaves a little to be desired in terms of more advanced presentations and experiences.
New, and custom experiences which allow the user more control over the resulting data are required if the technology is to really become useful within the industry.
Imagine if it were possible for an onsite development planner to map out the entire project before them through visualized progress, safety statistics, and worker insights, spec details, all of which were presented through a virtual space. Although that information and data are able to be made visible almost instantly, in order to present it in a more meaningful way such experiences must be crafted at a software level. If you begin considering ways in which users may wish to manipulate, edit, or review their data, the finely crafted spaces become even more significant.
There are already a number of virtual reality visualizations, such as The New York Times’ Pluto experience or Google Labs’ Brexit visualization. However, it may be noted that in a business environment, these are not the kind of data visualizations and content you would be likely to see.
This poses the key question for modern applications of VR in data and analytics: How will the technology and space be used by professionals?
Is VR the Answer?
Ultimately, it must be understood that although there is a great deal of potential for VR, it will be a while before the technology comes into its own in the world of data visualization. As the future of data visualization, VR seems like a promising concept. However, there is a long way to go before academia and businesses actually begin to employ it.
In addition to hardware innovations and new forms of technology, virtual experiences must be built and designed by the developer and software engineers. Additionally, ways in which virtual and augmented reality can be useful are still being worked out. What is the best way to enable data manipulation and editing in a 3D environment? How do we generate systems which enable procedural visualization models and data imports? All of this will have to be worked out in due course.

This information has been sourced, reviewed and adapted from materials provided by Kolabtree, originally written by Nathan Sykes. Nathan Sykes is a freelance tech writer from Pittsburgh, PA. He enjoys writing about the latest news and trends in AI, big data, cloud computing and other emerging technologies.
For more information on this source, please visit Kolabtree.