Silicon carbide equivalent circular area diameter distribution analysis of two samples F8 and F6 are illustrated below with their respective statistics.
Making a comparison of these analyses is suggestive that sample F6 has a mean size 44% bigger than sample F8.
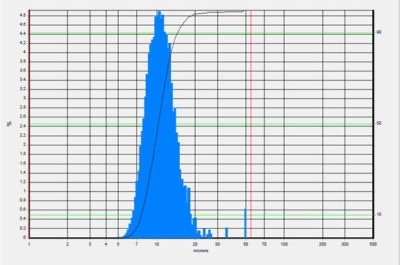
Silicon Carbide F8 Volume Distribution
ECA Diameter – Volume: 1.0 – 55.06 microns
| . |
. |
| Total count |
20,057 |
| Mean |
11.4 microns |
| 10.00% |
7.8 microns |
| 25.00% |
9.0 microns |
| 50.00% |
10.6 microns |
| 75.00% |
12.6 microns |
| 90.00% |
15.0 microns |
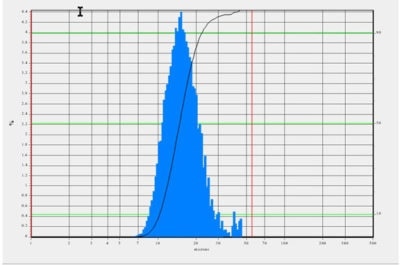
Silicon Carbide F6 Volume Distribution
ECA Diameter – Volume: 1.0 – 55.06 microns
| . |
. |
| Total count |
19,919 |
| Mean |
16.4 microns |
| 10.00% |
10.6 microns |
| 25.00% |
12.5 microns |
| 50.00% |
15.2 microns |
| 75.00% |
18.8 microns |
| 90.00% |
22.9 microns |
The Vision Analytical Sentinel Pro Particle Insight enables the selection of any particle size range of a sample and at once identify statistics throughout this chosen size range. It is then possible to isolate and/or identify each particle greater than 30 microns for each sample. It can be observed that sample F8 has just three particles bigger than 30 microns while sample F6 has 36 such particles. Also, sample F8 particles greater than 30 microns are near 50 microns in size which will, accordingly, skew its volumetric particle size distribution.
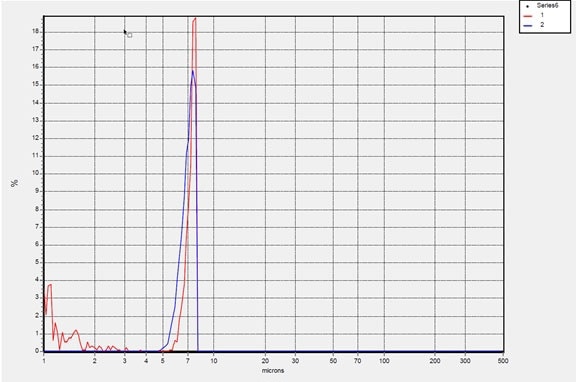
The provided overlay capabilities of the Sentinel Pro can show these differences as illustrated below. It can be noted that no particles can be seen under five microns when the volumetric display is used.
Silicon Carbide F8 vs F6 Volume Overlay
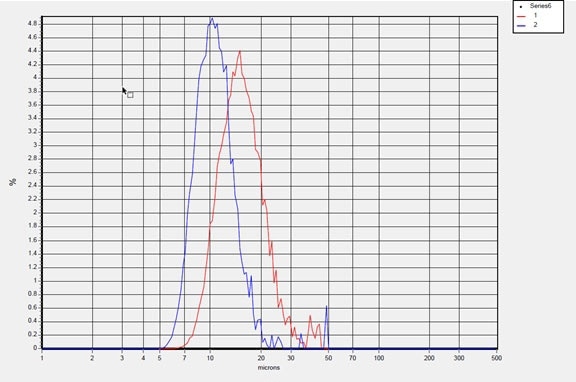
Blue Line: Silicon Carbide F8 Red Line: Silicon Carbide F6
The Vision Analytical Sentinel Pro Particle Insight has another characteristic beyond the usual laser analysis. If care is taken to choose a sample concentration, so every image contains a single particle, the number of particles for a given particle size can be examined, in much the same way as a particle counter. The bias towards bigger particle volume contributions to the distribution analysis is removed by the number distribution. Smaller particles then have identical weight to bigger particles and the number of particles at any sizes range can then be observed. The Sentinel Pro can illustrate how the statistics differ between these samples by number, even for all 30 shapes captured.
Below is an overlay of the samples in question by a number distribution. It can be noted that the particles above 30 microns “disappear” due to a single large 50-micron particle in sample F6 being an inconsequential percentage of the total amount of particles measured.
One more observation should be noted: It appears sample F8 fines under 5 microns are different than sample F6.
Silicon Carbide F8 vs F6 Number Overlay
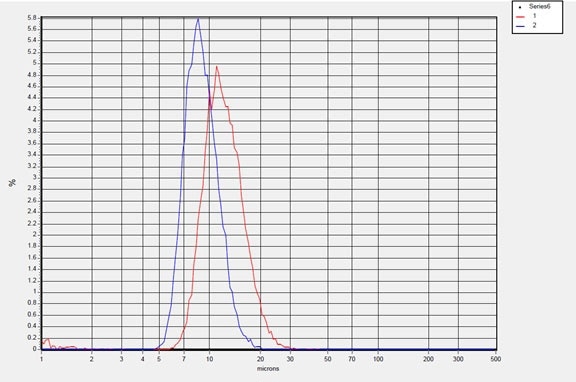
Blue Line: Silicon Carbide F8 Red Line: Silicon Carbide F6
The Sentinel Pro software enables the selection of any ECA diameter range, the calculation of new statistics throughout this range and the presentation of data and graphs for this new focus analysis. The selection of an ECA diameter from 1.0 – 5.0 microns should demonstrate the importance of the fines between these two samples.
Below is an overlay of these samples by the number of particles under 5 microns.
Silicon Carbide F8 vs F6 Number Overlay Below 5 microns
Blue Line: Silicon Carbide F8 Red Line: Silicon Carbide F6
The following shows the captured statistics of each sample under 5 microns:
Silicon Carbide F8 Volume Distribution Below 5 microns
ECA Diameter – Number: 1.0 – 5.0 microns
| . |
. |
| Total count |
25 |
| Mean |
2.9 microns |
| 10.00% |
1.1 microns |
| 25.00% |
1.3 microns |
| 50.00% |
1.6 microns |
| 75.00% |
4.8 microns |
| 90.00% |
5.0 microns |
Silicon Carbide F6 Volume Distribution Below 5 microns
ECA Diameter – Number: 1.0 – 5.0 microns
| . |
. |
| Total count |
256 |
| Mean |
1.4 microns |
| 10.00% |
1.0 microns |
| 25.00% |
1.1 microns |
| 50.00% |
1.2 microns |
| 75.00% |
1.5 microns |
| 90.00% |
1.9 microns |
Conclusions
- Sample F6 has ten times the amount of fines under 5 microns.
- The majority of sample F6 fines are notably less than sample F8.
- Sample F6’s volumetric mean is 44% bigger than sample F8, yet contains many more fines.
- F8 could be resampled to see if the measurement of any particles above 30 microns can be repeated.
- Sample F8 could produce a tighter, more uniform particle size distribution with fewer fines.
- Sample F8 could be the better product; whether these samples perform differently in the process could be considered.

This information has been sourced, reviewed and adapted from materials provided by Vision Analytical Inc.
For more information on this source, please visit Vision Analytical Inc.