Flow curves of polymer melts (the graph of viscosity versus shear rate in the log-log scale) have two distinct behaviors governed by Newtonian and Power law. The Newtonian behavior dominates at very low shear rates, where the viscosity is independent of the shear rate and it approaches the value known as the zero-shear viscosity.
After this, the viscosity starts to reduce at a critical shear rate (y0). The Power law behavior dominates at higher shear rates, where the viscosity decreases with increasing shear rate, with a negative slope of (n – 1). The n parameter is known as the Power-law index.
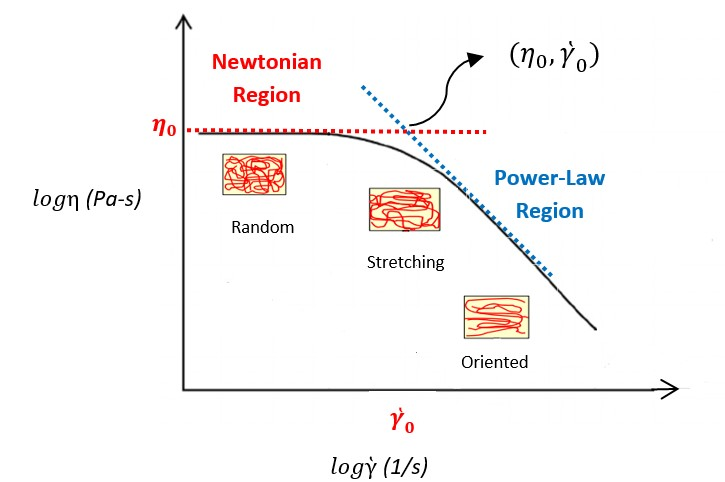
Figure 1. Typical flow curve of polymer melts. Image Credit: Dynisco
The flow curve of polymer melts is bound by two limiting slopes (dashed lines) which determine the zero-shear viscosity value (n00 and the Power-law index value (n)), as shown in Figure 1. These parameters can be used to estimate molecular weight (Mw) as well as the breadth of the molecular weight distribution (MWD). Other factors that may have an effect on the shape of the viscosity-shear rate curve include pressure, temperature, filler, lubricant and plasticizer.
Quantitative relationships have been defined in order to represent the shear rate dependency of viscosity of polymer materials. These include the Bird-Carreau-Yasuda model, the Cross-WLF model, the Cross model, and the Power-Law model. The Power-law model can be represented by the equation below:
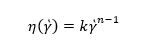
where n is Power-law index and k is consistency (Pa-s). Polymer melts typically have n values in the range of 0.2 – 0.6, depending on the type and chemical structure of the polymer. The Power-law model only fits the shear-thinning (Power law) portion of the curve and is a useful model for process control but it cannot describe the Newtonian region of the curve.
The capillary rheometer data normally falls into the shear-thinning region of the curve and can be fitted perfectly by the Power-law model. Power-law model fitting analysis (from LabKars software) on two types of polyethylene (PE) materials using a Dynisco LCR7001 capillary rheometer is shown in Figure 2.
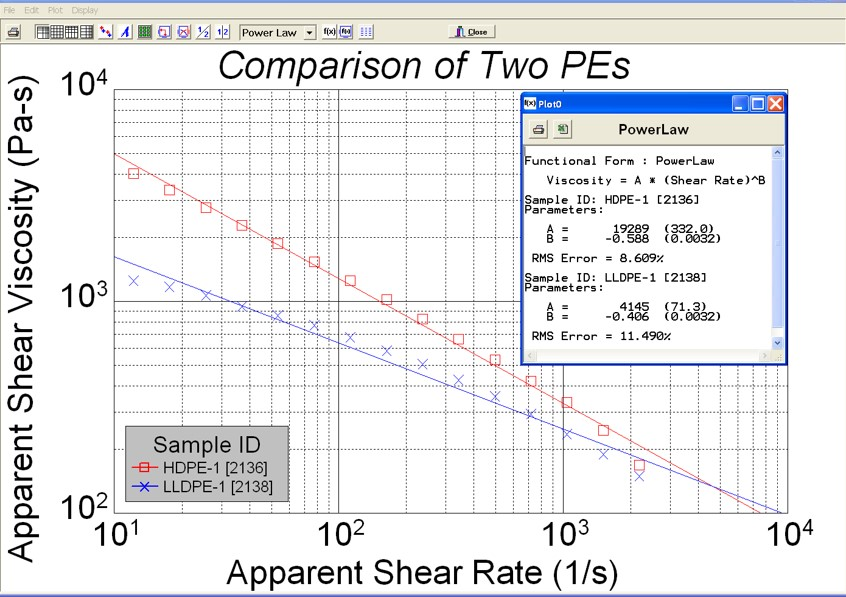
Figure 2. Power-law model fitting analysis. Image Credit: Dynisco
The Cross model is represented by the equation below:
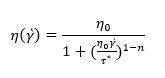
where η0 is the zero-shear viscosity (Pa-s), τ* is the critical shear stress (Pa) or stress at the break in the curve, and n is Power-law index.
The modified Cross model fitting analysis (from LabKars software) on two types of PE materials using a Dynisco LCR7001 capillary rheometer is shown in Figure 3.
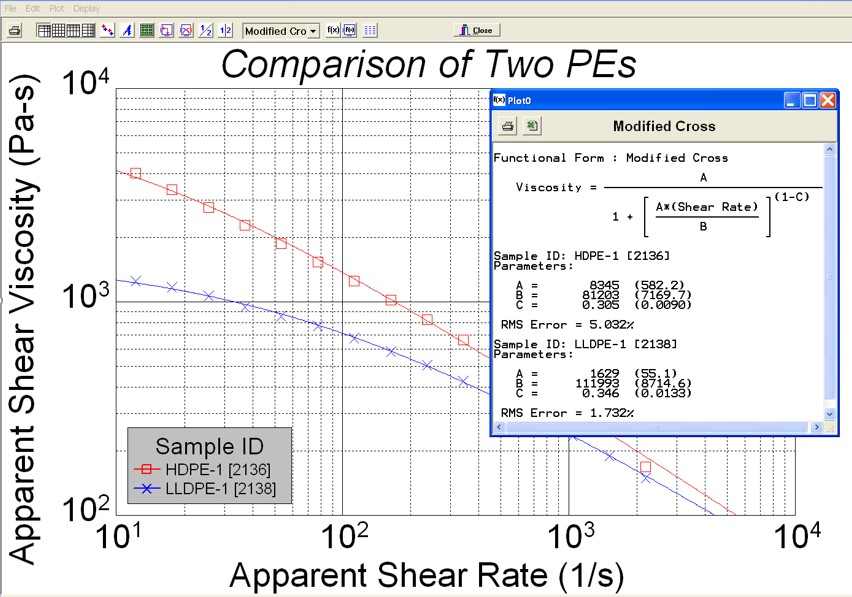
Figure 3. Modified Cross model fitting analysis. Image Credit: Dynisco
This model is a combination of the Newtonian and Power-law regions and therefore describes the flow curve more completely. This model is useful for showing the zero-shear viscosity value.
References
- J.M. Dealy, and K.F. Wissbrun, Melt Rheology and its Role in Plastics Processing: Theory and Applications, Van Nostrand Reinhold, New York (1990).
- C.L. Rohn, Analytical Polymer Rheology, Hanser (1995).
Acknowledgments
Produced from materials originally authored by Azadeh Farahanchi, Rheological Scientist, Ph.D.

This information has been sourced, reviewed and adapted from materials provided by Dynisco.
For more information on this source, please visit Dynisco.