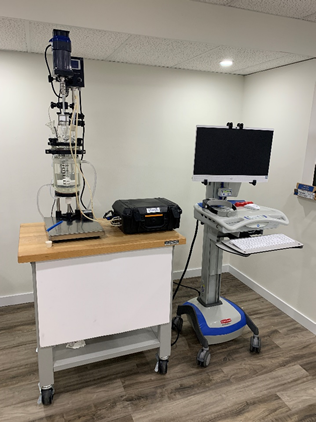
The Pi Mobile In-Process system is a state-of-the-art dynamic image analyzer incorporated into its analysis module and a portable battery-operated control unit on a tether.
This system is perfect for applications where monitoring not just the diameter but the shape of raw materials is vital for on-line processes. Ensuring the same morphology is crucial to ensure the efficacy of the final product in a number of crystallization processes.
It is vital to utilize a high-resolution analytical tool that can supply as much information as possible about the crystals being formed over time. The Pi Mobile has been designed to work where raw material manufacturing processes require real-time feedback to make critical process decisions.
It is able to draw a sealed sample from a reactor or process for direct analysis and can return the measured sample back into the process, or to waste. Without interruption, the analysis of the raw material is carried out “on-line”, next to the reactor or process. As it is portable in nature, the Pi Mobile can be easily disconnected from one process and reconnected to another without any disruption. To ensure minimal dead-volume from the process, the analysis module is connected via a tether allowing it to be very close to where the process is occurring while the control unit can be out of the way offering the user unobstructed access to the process.
A Qualification Program using NIST traceable samples is available to certify the system annually and contains all the required paperwork to be ready for FDA audits for compliance with 21CFR Part 11 as well as Data Integrity guidelines.
The Pi Mobile In-Process system allows users to examine crystallization processes in real-time, by capturing particle size and shape with Dynamic Image Analysis technology. It is a high-speed direct measurement and the data rendered includes:
- Over 30 shape measures for each particle, plus high-resolution thumbnail images of each measured particle.
- See real-time process changes and track parameters such as size, aspect ratio, concentration, and other measurements as they happen, using the Time Series Tracking feature.
- Imaging of dispersed particles to ensure proper quantitative analysis, unlike competitors that primarily render qualitative information due to particle overlap.
- Data confirmation with thumbnail images enables users to identify each particle analyzed. Classification features are available to categorize particles based on one or more shape measures.
- True particle concentration (particles per ml) of a process. This is vital to understanding the concentration of a reaction, unlike others that just “Count” the number of particles measured.
With over 30 shape parameters, thumbnail images, and time stamp information, data can be utilized to truly track particle dynamics in a representative manner. Typical measurements are able to reach up to tens of thousands of particles in seconds. To fully understand the dynamics of your sample change over time and temperature, this representative sampling is needed.
In-Process; In-Line Versus Sealed On-Line Measurement Analysis
Traditional particle size measurements are usually performed “off-line” or what is also known as “at-line.” These measurements require the user to extract a sample aliquot, take it to the measurement device which is located “off-line” on a lab bench, or sometimes located next to the process being analyzed, “at-line”. The sample is prepared and measured, and data is gathered. For each aliquot taken this practice would need to be repeated, which is not practical for monitoring fast-changing particle kinetics. Today, in-process operations require more immediate and detailed feedback to make the correct decisions.
In-line measurements are sometimes probe-based and usually provide extremely limited data such as the cord length of the limited number of particles it can distinguish in the sample. Data from probe-based instruments are negatively affected by concentration, and due to lack of particle dispersion, gathering accurate data is difficult. Probe-based instruments report the counted number of measured particles, but this is not a true indicator of particle concentration in the reactor. So, most probe-based particle measurement systems are usually employed for qualitative information not quantitative data.
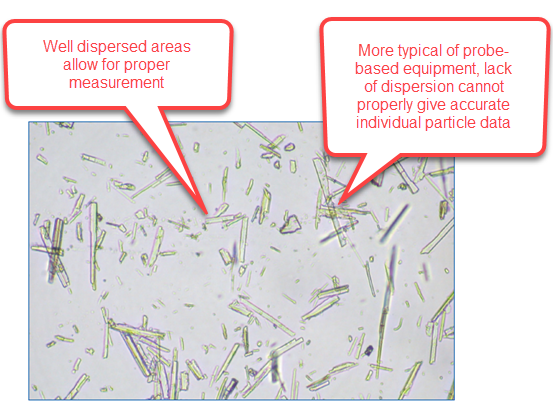
The above figure is shown as a representation of how crucial it is to ensure proper particle dispersion to accurately measure particles. Areas of particles which are grouped cannot properly measure for individual particle data and can be misleading to those monitoring the process when reported.
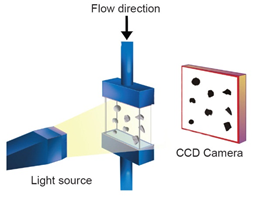
The Pi Mobile IPS (Insight In-Process System) utilizes a sealed on-line measurement where a milliliter-sized aliquot is continuously drawn, analyzed, and returned to the reactor with no ambient contact. Proper tubing and low dead volume capabilities make sure that there are no temperature alterations from when the sample is extracted to the few seconds when it is returned. The flow architecture is designed to ensure the correct particle dispersion for accurate and discrete measurement of particles and accurate concentration measurements, i.e. particles per measured volume, not only particle count.
Size-Only Versus Size and Shape Measurement
Particle analysis equipment which supplies size-only data will do so as long as the particles are round. Obviously, for most industrial samples this is not the case, particularly when it involves crystal growth.
Cord length measurements which are usually found with in-process probe-based equipment will measure particles as they enter and exit the measurement zone. These focused laser beams can experience optical differences within the particle that, yet again, can give incorrect measurements if particles are crystalline in nature.
In the example below, a cord length of this crystal can be one size if the particle crosses the focused beam one way and if the crystal enters the detection zone in a different direction it will be a vastly different length. Which is correct?
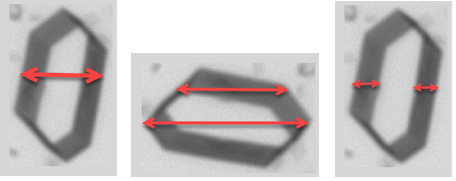
In some instances, the refractive index difference of the carrier fluid versus the translucence of crystal particles can have adverse effects on rendered size values where just the particle's crystal edges are measured.
The Pi Mobile IPS (In-Process System) utilizes dynamic image analysis and disperses the particles in such a way that the measurements are all performed in a discrete way. Images are gathered and calculations on individual particles are performed in real-time. Possessing more than just the size supplies the operator with more information about their process and how it is evolving over temperature and time. An actual Particle Insight image that shows what a size-only measurement would calculate is shown below.
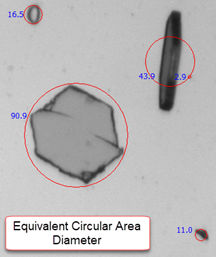
As can be observed in the image, assuming all particles are round can supply misleading data which can result in false determinations about the process and result in scrap or waste of materials.
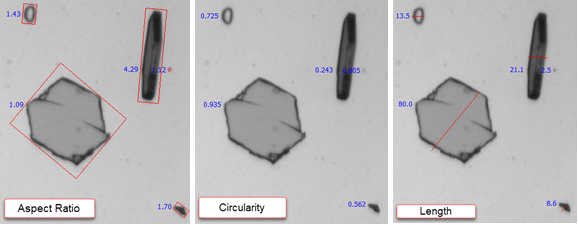
Here the additional shape information for each of the thumbnail images can be observed. The Particle Insight does an outstanding job at dispersing particles in order to gather exact quantitative information. It also quickly supplies confirmation thumbnails images or tens of thousands of particles. This allows the user to monitor shape over time vs temperature and concentration.
Time Studies of Size, Shape, Concentration, Temperature
In order to understand in-process changes in particles as changes in temperature are made, real-time automatic particle analysis overtime is needed.
The Pi Mobile IPS (In-Process System) is designed to capture particle shape, size, and concentration of particles over time and as temperature alterations are happening in the reaction vessel. Data is trended in real-time and individual statistics and thumbnail images of each measured particle can be recalled and reviewed.
The below charts reflect the changes in statistics and measures over time.
.jpg)
Identification and Confirmation of Events Throughout the Process
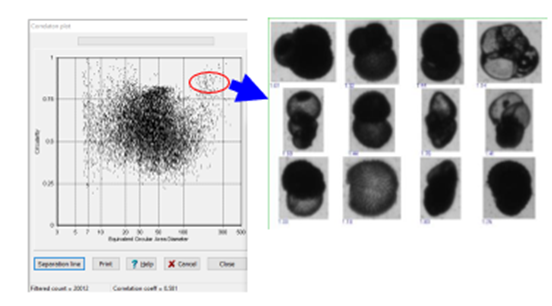
The user is able to review the many individual analyses performed after trending a process from beginning to end. This enables the user to identify if there are any rare events by utilizing a Correlation Plot and gathering confirmation of each particle by a thumbnail image.
The unique adaptation of this high-resolution, real-time technique to an on-line use enables users to obtain more detailed information about their process allowing them to make more accurate decisions regarding their samples. Vision Analytical is focused on Dynamic Image Analyisis as its core technology and continuously improving and applying it to meet the challenging needs of many market sectors.

This information has been sourced, reviewed and adapted from materials provided by Vision Analytical Inc.
For more information on this source, please visit Vision Analytical Inc.