Key Issues
- Continuous online monitoring of underground CO2 sequestration
- Simultaneous quantification of other soil gases, such as N2, O2, H2O, and CH4
- Quick detection of abnormalities at a sequestration site
Introduction
A promising approach to reducing the anthropogenic release of atmospheric greenhouse gases is the geologic storage of carbon. This involves greenhouse gas species such as Carbon Dioxide (CO2) being sequestered in underground reservoirs instead of being released into the atmosphere where they will likely contribute to global climate change.
One of the primary challenges linked to CO2 sequestration is that soil gases must be accurately measured at the sequestration site in order to ensure its continued integrity.
Vibrational-spectroscopic methods like mid-infrared (IR) absorption and Raman spectroscopies may offer a useful means of continuously monitoring important species such as H2O vapor, CO2, CO, N2, O2, SOx , NOx , and CH4 in soil gas, comparing these against ambient levels to evaluate the integrity of sequestration sites in real time.
A considerable challenge in gas monitoring at sequestration sites is effectively distinguishing between differences in CO2 levels that could indicate a problem with the site, and differences triggered by natural phenomena such as respiration at plant roots, photosynthesis, and the natural cycling of organic carbon in soil.
To address this issue, any natural variation at the site is measured for one year or more, allowing a baseline to be established. Future monitoring of the site will then involve comparative analysis of CO2 within the borehole itself and in the surrounding atmosphere. This article outlines a viable means of comparing the CO2 concentrations at these sites.
Experiment
Vibrational spectroscopy is ideal for the analysis of small homonuclear and heteronuclear soil gases. It provides easily quantifiable, sharp spectra while being able to collect these in real time via small sampling loops and other standardized equipment.
The experiment outlined here used three compartments. These were, a well completion - the finished well, ready for injection, an external gas circulation module, and a range of sensors, including an IR analyzer, a Raman spectrometer, a pressure sensor, and moisture and temperature sensors. Figure 1 features a synthetic diagram of this gas-analysis system.
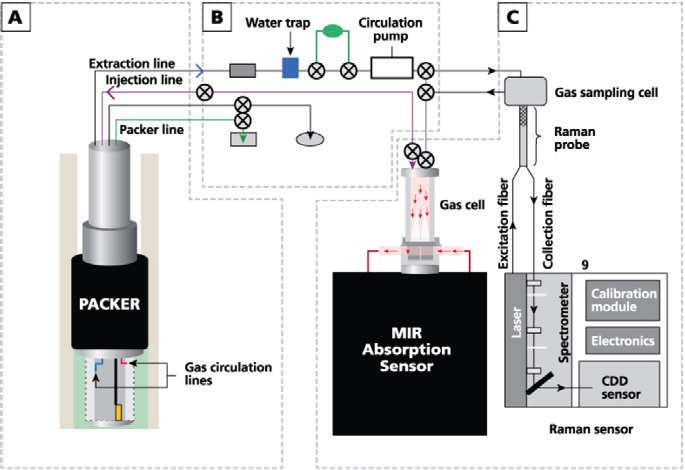
Figure 1. Schematic diagram of the gas-analysis system, showing (A) borehole and completion, (B) external module for gas circulation, and (C) IR and Raman analyzers. Image Credit: Adapted with permission from Reference 1. © 2013 Elsevier.
A Kaiser Raman gas-phase analyzer using 532 nm laser excitation was used to collect Raman spectra. This instrument provided a usable range of 175 to 4325 cm-1 for the Raman data, while an AirHead™ Raman probe head was fitted in gas flow loop with a custom gas cell, then connected to the spectrometer using optical fibers.
The custom gas cell was specially constructed to take advantage of multi-reflection scattering amplification by focusing the laser through a sapphire window then reflecting it with mirrors. This allowed the Raman backscatter to be collected through the sapphire window before being transmitted through the probe head to the spectrometer.
Results
Figure 2 displays a characteristic Raman spectrum of soil gas at the sequestration site investigated in this study, with key peaks for N2, O2, H2O vapor and CO2 appropriately labeled.
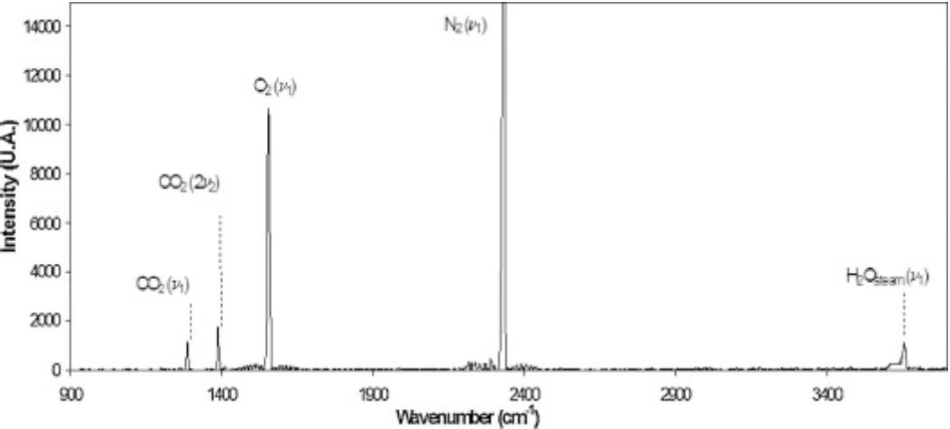
Figure 2. A typical Raman spectrum measured at the site in this study. Key peaks: H2O vapor (3657 cm-1), N2 (2331 cm-1), O2 (1555 cm-1), and CO2 (Fermi dyad at 1388 and 1285 cm-1). Image Credit: Reprinted with permission from Reference 1. © 2013 Elsevier.
The distinctive, sharp peaks of the Raman spectrum allow for the rapid, accurate quantification of soil gases such as these.
Figure 3 contrasts the measurements of CO2 variation over a four-day period in January 2011, during the injection operation. These figures confirm that the Raman data compares well to data from spectral measurements.1
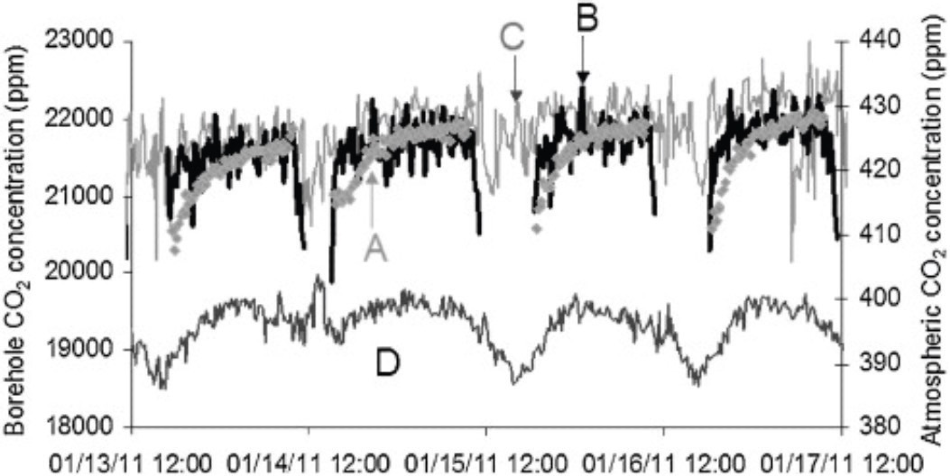
Figure 3. Diurnal variation of CO2 at the site and in the atmosphere over four days in January 2011. A, B are borehole CO2 concentrations calculated by IR, while C is the borehole CO2 concentration calculated from the Raman spectrum using the Fermi dyad at 1388 and 1285 cm-1. D is the atmospheric CO2 concentration measured by IR. Image Credit: Reprinted with permission from Reference 1. © 2013 Elsevier.
Conclusion
The results found within this study indicate that Raman spectroscopy is a feasible approach to the real time monitoring of soil gases at CO2 sequestration sites. Here, a Raman spectrometer linked to a well completion was used to effectively monitor concentrations of numerous important soil gases (including CO2) at a sequestration site.
Raman spectroscopy is not sensitive to liquid water, meaning that it facilitates continuous monitoring irrespective of wet or dry conditions. This offers a clear advantage over mid-IR absorption spectroscopy, which is impractical in wet conditions because of its broad liquid water spectrum.
However, because IR does offer excellent sensitivity in dry conditions, a coupling of both IR and Raman means that each technique can be used under its own ideal conditions. The use of fiber coupling also allows the Raman probe head to be situated within the completion, while the spectrometer base unit can remain easily accessible in a surface module.
Furthermore, several Raman probe heads can be installed at different locations at the site, allowing for comparative analysis. Locations could include boreholes themselves, sites close to injection wells, sites close to abandoned wells where integrity is a concern, sites close to underground gas pipes, or at natural sites like fault zones and aquifers.
References
- Taquet, N., Pironon, J., De Donato, P., Lucas, H. and Barres, O. “Efficiency of combined FTIR and Raman spectrometry for online quantification of soil gases: Application to the monitoring of carbon dioxide storage sites” International Journal of Greenhouse Gas Control, January 2013, 12, 359–371.

This information has been sourced, reviewed and adapted from materials provided by Kaiser Optical Systems, Inc..
For more information on this source, please visit Kaiser Optical Systems, Inc..