A range of signals is produced when a sample is subjected to the electron beam of a scanning electron microscope. X-rays are one of the signals that can deliver important insight into the chemical composition of a material.
The X-ray signal collected consists of background X-ray radiation and more crucially, X-rays of distinct energies, which indicate the elements found in the sample. Due to this, one of the most popular detectors that are added to a scanning electron microscope (SEM) is an energy dispersive X-ray detector (EDS).
This is employed not only to identify which elements are present in a sample, but can often offer information regarding the spatial distribution and quantity of these elements over very small volumes.
Hyperspectral imaging is a feature found in the majority of EDS systems today. At each pixel in the map data set, an EDS spectrum is acquired and is stored as a large data cube (Figure 1).
The data set can be processed again at any time. Spectra can be extracted from alternative regions within the map, and new element maps can be produced. EDS systems from JEOL can construct quantitative maps (QMap), along with the inclusion of hyper spectral imaging.
A QMap can be informative during sample characterization if peak overlaps or high background have occurred. A quantitative analysis is conducted at every point in the map data set in QMap.
The background is subtracted during this process, and in the majority of cases, it can effectively deconvolute overlapping X-ray peaks. A selection of regular peak overlaps with EDS systems are outlined in Table 1 below.
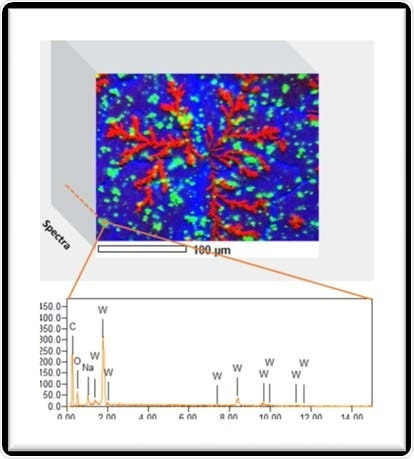
Figure 1. Data Cube – Hyperspectral Imaging with EDS. Image Credit: JEOL USA, Inc.
Table 1. Common X-ray Peak Overlaps with EDS. Source: JEOL USA, Inc.
Element
X-ray Line |
Interferes With |
| S Kα & Kβ |
Mo Lα, Pb Mα |
| Ti Kα |
Ba Lα |
| Mn Kβ |
Fe Kα |
| As Kα |
Pb Lα |
| W Mα and Mβ |
Si Kα and Kβ |
| Zr Lα |
P Kα |
To demonstrate the advantage of QMap in Hyperspectral Imaging, take the example of a ceramic automotive brake pad. These pads are a complicated fusion of numerous components. A key challenge when manufacturing these products is managing the distribution and quantity of the distinct ingredients.
An SEM can perform a crucial role in analyzing this distribution, along with examining wear or failures. Figure 2 illustrates the EDS sum spectrum from a map data set. It is clear that many elements are present in the EDS sum spectrum. In this example amongst the components both titanium and barium are identified.
The X-ray intensity maps for these components appear to be identical because the X-ray lines for these elements overlap in an EDS system. Namely, the spatial distribution of the titanium versus barium elements is not resolved (Figure 3).
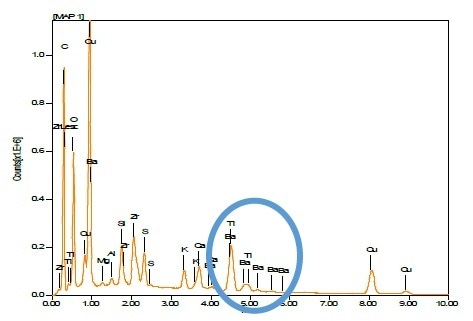
Figure 2. Ceramic Brake Pad - Sum Spectrum from EDS Hyperspectral Imaging Data Set. Image Credit: JEOL USA, Inc.
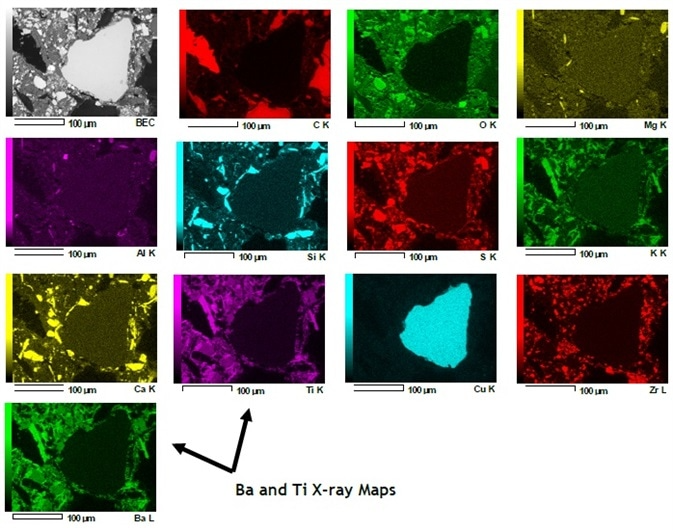
Figure 3. Ceramic Brake Pad - X-ray Maps (Barium and Titanium X-ray Maps and Overall). Image Credit: JEOL USA, Inc.
By processing the data to produce a QMap, the titanium and barium X-ray lines are successfully deconvoluted to provide a clear view of the spatial distribution of these components in this brake pad (Figure 4).
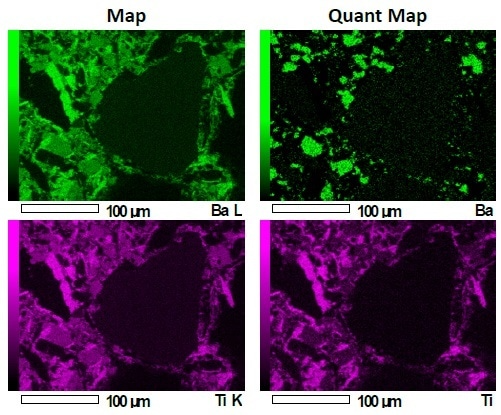
Figure 4. Ceramic Brake Pad Showing Barium and Titanium X-ray Maps Before and after QMap. Image Credit: JEOL USA, Inc.

This information has been sourced, reviewed and adapted from materials provided by JEOL USA, Inc.
For more information on this source, please visit JEOL USA, Inc.