In order to cut, grind and polish softer materials, an abrasive is typically used. It is either a natural or a synthetic mineral, which is applied liberally to shape or finish a workpiece to a pre-ordained specification.
The abrasive materials are often sourced from mines or are produced synthetically. Naturally mined abrasives include corundum, diamond, emery, garnet and quartz. Synthetic abrasives include alumina, boron nitride, boron carbide, silicon carbide and synthetic diamond.
Generally, the abrasive materials are synthetic rather than natural for industrial applications so as to ensure the supply and consistency in their properties. Diamond naturally occurs, but typically it is industrially produced. Likewise, corundum is also naturally occurring but today is more largely manufactured from bauxite.
With the capacity to shape a surface by friction and rubbing, abrasives are used across a broad range of domestic, industrial and technological applications, producing a great variation in the particle size and shape of the abrasive materials.
Abrasives are applied in numerous scenarios, from the sandpaper a carpenter uses to make the wood smoother to abrasive polishes that make a high cost shiny finish for a car.
Even the abrasives found in toothpaste that clean and polish teeth must be just coarse enough to polish but not to corrode over a period of time: more sensitive teeth will need a lesser degree of abrasiveness.
Characteristics of Abrasives
All abrasive powders are produced to remove materials, and when selecting one for a particular application, you need to think about the characteristics specifically required.
There are numerous factors that considerably influence the behavior of abrasive material, including size, shape, hardness and self-sharpening ability of the particles. Hardness is determined by values of the Mohs, Vickers, or Knoop scales which will identify which material can scratch another when measured.
The abrasive has to be harder than the material being worked upon. Diamond is considered the hardest material and has a value of 10, which is the maximum value on Mohs scale of hardness. On this scale, a majority of minerals are rated seven or higher.
When abrasives are being utilized for grinding wheels, the self-sharpening element is key.
Table 1. Mohs hardness values of several common abrasive materials. Source: Bettersize Instruments Ltd
| Abrasive Materials |
Diamond |
Garnet |
Corundum |
Silicon Carbide |
Zirconium Oxide |
| Mohs |
10 |
7-8 |
9 |
9-9.5 |
7.5 |
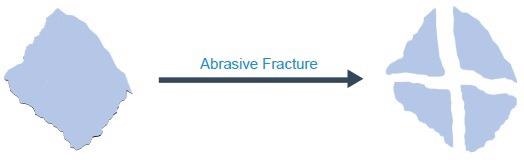
Figure 1. Diagram of self-sharpening behavior of abrasives. Image Credit: Bettersize Instruments Ltd
This is because when the abrasive grains eventually blunt after grinding, the force of grinding increases, and this increase in grinding force can result in the break-up of abrasive particles, at which point the new angular grains come out, making the grinding material regain its sharpness.
Usually, a prime abrasive material offers optimal resistance to the point of wear yet cleaves before significant dulling occurs, thereby maintaining the requirements of both stock removal and finishing.
Particle size is one of the most crucial parameters in relation to the performance of abrasive products. Abrasives are either classified or crushed to a particular size, usually between 10 μm to 2 mm, depending on the application.
Historically sieve screens, meticulously fabricated from metal threads of a precise size and number per square inch, have been utilized to measure abrasives. In each sieve, the grit number signifies the number of openings per linear inch to classify the particle size.
However, they only measure the second longest dimension, which is suitable for the dulling stage where the particle is near spherical, but not if your ideal abrasive is irregular.
Choosing the best material with the suitable size classes will allow the users to achieve professional results in both finishing and fabrication, whether using metal, wood, or plastic for an application.
The below table exhibits standard grit grades for each stage of the application process. Grades are conversely proportional to grit size. Thus, fine abrasives make up the higher grades.
While no single abrasive can work in every application, as illustrated in Table 2, there are numerous grades and types of abrasives from which to choose the most fitting in order to meet an application standard. In addition, there are different standards on hand to classify the size range of abrasives.
Table 2. Typical grit grades of abrasives for each stage of the application. Source: Bettersize Instruments Ltd
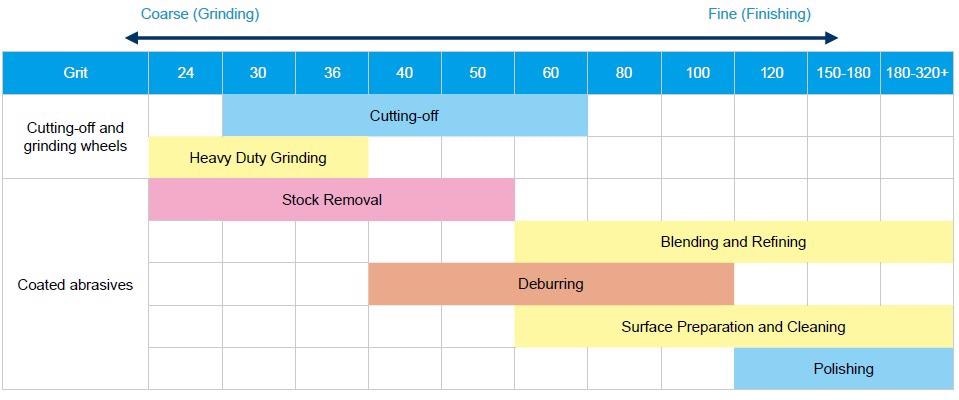
One of the most frequently used standards is the FEPA grading system, which is the European standard of grit sizes. There are several other grading systems throughout the world which include a coated abrasive system from the US called CAMI and F220Japanese Standards – JIS, the US system ANSI and. All FEPA grit sizes are preceded with the letter ‘F,’ e.g., F220.
Conventionally, techniques using sieves and sedimentation had been applied to characterize the sizes of abrasive particles. Abrasives are divided into two categories: macro-grits predicated on screen sizes F4 to F220; and micro-grits contingent on sedimentation (F230 to F2000).
As well as the particle size, the particle shape is another crucial performance factor of abrasive material.
Previously, abrasive powders were consigned to their final use for different applications after undergoing analysis by a particle-size-only measuring system in order to maintain control over powder quality.
Size-only systems will display sizes under the assumption the particles are round. They do not convey shape information but only offer a spherical volume equivalent which is only acceptable for low aspect ratio powders.
This is not an appropriate application where the shape of the particles is immediately associated with their performance. Figures 2 and 3 display the SEM images of zirconium oxide, a frequently used abrasive, with sharp edges.
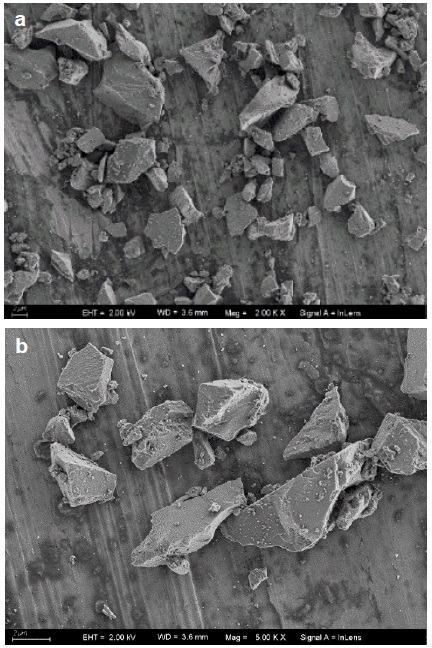
Figure 2 and 3. SEM images of a common abrasive (zirconium oxide) having sharp edges. Image Credit: Bettersize Instruments Ltd
The shape of an abrasive can vary and may be spherical, blocky, semi-round, or angular. An angular abrasive ensures the fastest cleaning rate when eliminating tightly adhering material or contamination from the substrate due to its sharp edges.
These sharp edges of a hard, angular abrasive generate steep peaks and valleys in the anchor profile, thus enlarging the surface area and providing an exceptional finish for the mechanical bonding of a coating.
These sharp edges can be only seen in SEM images and dynamic image analysis (DIA) but not by sieving, sedimentation, or conventional laser diffraction analysis.
If these particles were all smooth and round, the removal performance would be inadequate.
Round particles lacking cutting edges are typically employed to pound a surface, whilst particles with sharp edges remove surface material on impact by reducing the surface area in contact with the workpiece and subsequently enhancing the localized contact pressure.
Measurement Technology
Sieve analysis is a conventional measurement method for abrasives, which is inhibited by its capacity to measure very small sizes and is inclined towards shape bias. Presently laser diffraction is growing in popularity as a measurement technique.
This is due to its ability to cover almost all of the abrasive size ranges, particularly in the micro-grit range. The Bettersizer S3 Plus can measure the precise particle size for both micro grits and macro grits.
What is more, the size range of the Bettersizer S3 Plus measuring system is 0.01 to 3500 μm due to the combination of two technologies – laser diffraction and dynamic image analysis. Figure 4 displays the technique of combining laser diffraction and dynamic image analysis on which the Bettersizer S3 Plus is established.
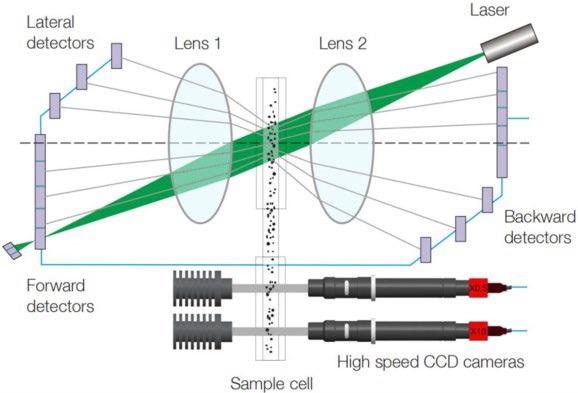
Figure 4. Schematic diagram of the combination technique of the Bettersizer S3 Plus. Image Credit: Bettersize Instruments Ltd
The Bettersizer S3 Plus is not just a laser diffraction particle size analyzer, but also, it has the capacity to capture images of the measurement sample as it is fitted with two high speed CCD cameras (0.5X and 10X magnification).
Throughout the measurement, the particles scattered in the medium are fed through two measuring sampling cells. In the first sampling cell, short-wave laser light (532 nm) is pumped through the sample and is dispersed depending on particle size, thus facilitating the measurement of extremely small particles down to 10 nm.
While this process takes place, the CCD cameras take pictures through the second sampling cell to offer image analysis of particles in the range of 2 to 3500 µm, effortlessly covering the macro-grit size range.
Both techniques, laser diffraction and dynamic image analysis of particle size distribution measurement possess different features and benefits.
Laser diffraction has clear advantages in measuring wide distribution samples and small particles. As the particle size increases above 1 mm, precise quantitative measurement of those large particles can become dubious.
When the number of large particles is found to be in trace or low amounts, there will not be enough particles to statistically offer a reliable result. Other than measuring all particles as equivalent spheres, this is the only other shortcoming of the laser diffraction technique.
This is where the Bettersizer S3 Plus comes into its own because it does not depend on the laser diffraction to record the small number of large particles, and crucially it measures shape in all its various dimensions by dynamic image analysis.
Dynamic image analysis can calculate morphological values as well as having the ability to clearly see and measure the parameters of each particle.
For large particles, in addition to the size and morphology, the absolute number of particles can be provided, so the testing accuracy when measuring large particles is exceptionally high.
The precision of dynamic image analysis diminishes as the size of the particle reduces due to the limits of resolution and present capacities of CCD cameras.
As a result, the Bettersizer S3 Plus innovatively merges the advantages of the two techniques to measure the whole size range down to 10 nm microns and measure the shape down to 2 μm without any compromise.
Total advantage of enhanced measurement accuracy is achieved by combining both methods into one system covering a broad size range and measuring the determination of shape, which is becoming progressively more important.
Providing Size and Shape Information Comprehensively
The example below exhibits a study on the characterization of abrasives by utilizing the measurement of laser diffraction with concurrent dynamic image analysis.
The Bettersizer S3 Plus measured three corundum abrasive powder samples – fine, medium and coarse – to characterize both the size and shape of the particle. It has been demonstrated how these powders vary in size as well as how they are contrasted in their shape parameters.
As displayed in Figure 5, post-characterization of three different grits of abrasive powder samples, the results of particle size are ranked in the correct, expected order.
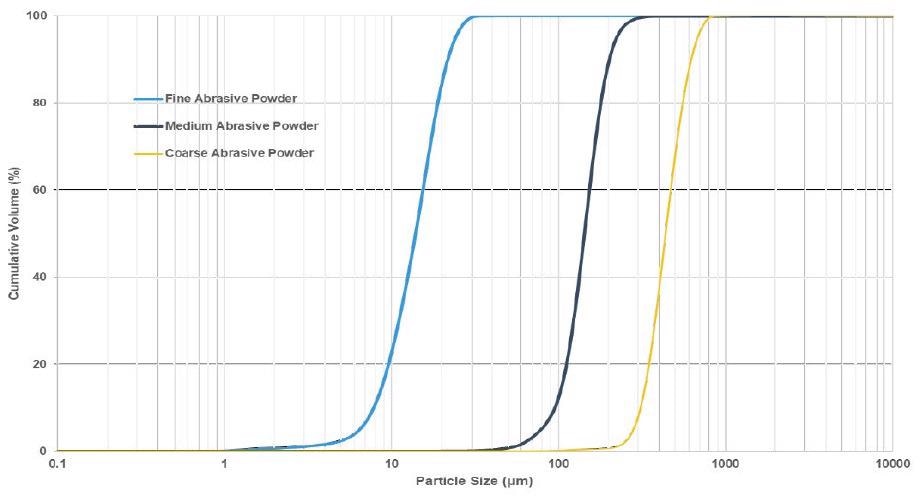
Figure 5. Particle size cumulative volume curves of fine, medium, coarse corundum powders using the combination technique. Image Credit: Bettersize Instruments Ltd
It can be speculated that coarser particles will have a greater impact force and therefore rapidly remove the material surface, creating a heavier texture.
Interestingly, in spite of the various sizes of the three abrasive powders, their circularity is considerably uniform, thus verifying the manufacture has good control of the grinding process of the manufacturer for these abrasive powders.
Moreover, as dynamic image analysis technique is based on counting, the Bettersizer S3 Plus has the capacity to effortlessly identify overly large or too spherical grains on an individual basis, or indeed by observing all the size and shape data parameters of all the particles generating number-based distribution and numerous other parameters.
Figure 6 exhibits a number of camera images captured by the Bettersizer S3 Plus of a coarse abrasive powder in detail. The number positioned above the image is the specific diameter chosen by the user (Feret length or Feret width etc.) for each particle.
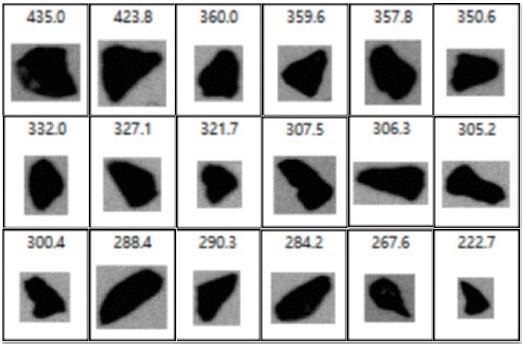
Figure 6. Camera images extracted from the individual particle list of a coarse abrasive powder (between about 500 and 200 μm). Image Credit: Bettersize Instruments Ltd
Size distribution is of significant interest, but a single size measurement is not appropriate since the abrasive particles are not spherical, and as illustrated in Table 4, length and width are just as necessary as the circularity.
Table 3. Critical parameters for characterizing the abrasive powders in figure 5 Figure. Source: Bettersize Instruments Ltd
| Sample |
D10 (μm) |
D50 (μm) |
D90 (μm) |
Aspect Ratio |
Circularity |
| Fine Abrasive Powder |
7.837 |
14.5 |
25.43 |
1.502 |
0.857 |
| Medium Abrasive Powder |
95.82 |
143.3 |
203.3 |
1.489 |
0.860 |
| Coarse Abrasive Powder |
311.4 |
439.3 |
618.8 |
1.522 |
0.861 |
Table 4. Critical shape parameters of some large particles contained in a coarse abrasive powder. Source: Bettersize Instruments Ltd
| . |
. |
. |
. |
. |
| Image |
 |
 |
 |
 |
| Length (μm) |
594.3 |
421.3 |
412.3 |
586.3 |
| Width (μm) |
423.8 |
359.6 |
350.6 |
306.3 |
| Diameter (μm) |
423.8 |
359.6 |
350.6 |
306.3 |
| Circularity |
0.808 |
0.841 |
0.855 |
0.782 |
| Convexity |
0.930 |
0.944 |
0.948 |
0.940 |
| Aspect Ratio |
1.402 |
1.172 |
1.176 |
1.916 |
One of the principal shape parameters produced by the Bettersizer S3 Plus is circularity. The more spherical the particle, the nearer its circularity approaches 1. The more stretched-out the particle, its circularity reduces.
All of the shape parameters selected were able to provide data in relation to abrasive morphology. Measurements from the Bettersizer S3 Plus have allowed different particle shapes to be characterized with greater precision, as well as identifying differences in shape between otherwise equivalent products.
Finally, for demonstration purposes, a new sample was produced from a mix of fine, medium and coarse samples. The particle size distribution of four samples, including the mix, is displayed in Figure 7.
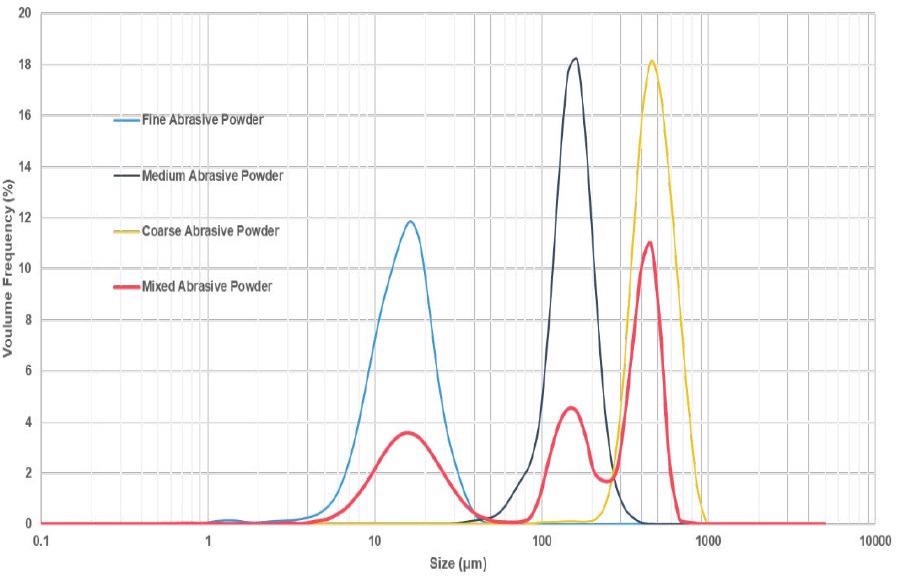
Figure 7. Particle size distribution comparison of fine, medium, coarse and mixed abrasive powders. Image Credit: Bettersize Instruments Ltd
The analysis of that mixture signifies the presence of the three original materials expected, and therefore, the high resolution capacity of the combination technique is confirmed as well.
Identifying Over-Sized Particles in Fine Powders
With the novel combination technique, the Bettersizer S3 Plus has the capacity to conduct detailed statistical analysis of the particle’s size and shape as well as allowing the user to see any large particle that may otherwise be outside specification.
Evaluation of an off-specification powder product provided by an abrasive manufacturer was conducted, and the results are displayed in Figure 8. To start, a well-known laser diffraction analyzer of another international brand was used to measure the particle size distribution of this abrasive product.
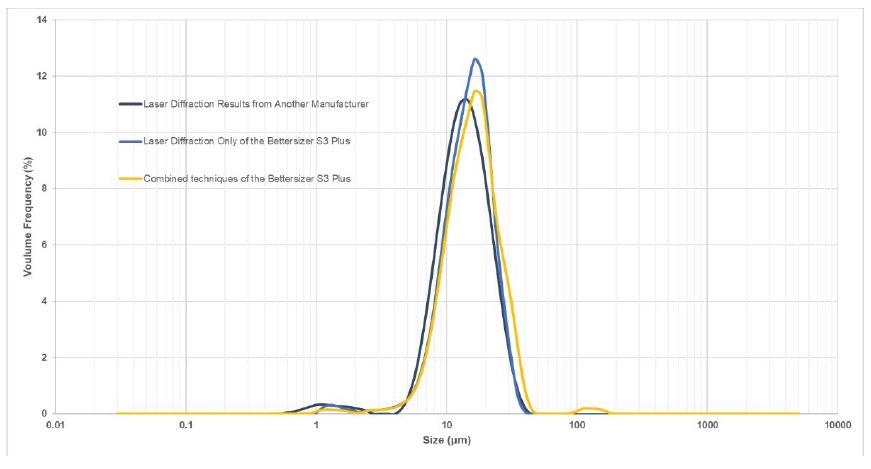
Figure 8. Particle size distribution comparison of different measurement methods. Image Credit: Bettersize Instruments Ltd
The result verifies that small particles of around 1 μm are present, thereby demonstrating the over-grinding of abrasives.
Next, the Bettersizer S3 Plus was used to evaluate the abrasive powder utilizing only the laser diffraction method: the main peak at around 14 μm and a small peak at 1 to 2 μm are shown in Figure 8.
Due to the dual lens & oblique incidence optical system (DLOIOS) feature, the laser diffraction method of the Bettersizer S3 Plus is extremely sensitive to the detection of small particles.
Finally, the abrasive powder was evaluated utilizing the combination technique (laser diffraction & dynamic image analysis) of the Bettersizer S3 Plus. Interestingly, there is an additional small peak situated next to the main peaks at 120 μm, as shown in Figure 8.
The overall result signifies unwanted ultrafine particles, as well as large particles, are present in this fine powder. In order to verify the presence of oversized particles (underground), the images of large particles were acquired and can be seen in Table 5.
Table 5. Images and diameters of over-sized particles present in the off-specification abrasive product. Source: Bettersize Instruments Ltd
| . |
. |
. |
. |
| Image |
 |
 |
 |
| Diameter (μm) |
124.1 |
120.0 |
116.6 |
| Image |
 |
 |
 |
| Diameter (μm) |
105.0 |
90.00 |
84.59 |
This proves that in this off-specification abrasive, unwanted large particles exist. This determines the abrasive powder is out of specification by the manufacturer due to the presence of both ultrafine particles but also overly coarse particles.
This experiment signifies that the Bettersizer S3 Plus, with its novel design, facilitates greater precision in the coarse range than traditional static light scattering devices and allows rapid identification of off-specification products.
Conclusions
Size alone is not adequate enough to guarantee the consistency of abrasives, and it is well-known across the abrasives industry that the shape of the particles is an equally important parameter to control.
As the Bettersizer S3 Plus uses the combination technique of both laser diffraction and dynamic image analysis, it can measure the size and shape of all abrasive powders.
In the first experiment, the key data relative to the size and shape of different non-spherical abrasive powders are comprehensively shown. In the second experiment, the size and shape information crucial to different non-spherical abrasive powders are shown extensively.
Additionally, in the second experiment, the presence of both ultrafine particles and overly coarse particles in the off-specification abrasive is detected owing to the success of the broad measurement range and exceptional sensitivity of the combination technique.
The Bettersizer S3 Plus has demonstrated its capacity to simultaneously characterize the size and shape of the abrasives and offer much more information than traditional laser diffraction analyzers.
Its capability to identify small amounts of oversized grit particles (a key factor from a QC perspective) sets apart its capabilities from those of standard laser-based particle sizing systems.
The Bettersizer S3 Plus’s dynamic image analysis technology can detect small amounts of grit in the presence of good products where other systems fall short. This makes it a valuable tool for the 21st century’s abrasive industry.

This information has been sourced, reviewed and adapted from materials provided by Bettersize Instruments Ltd.
For more information on this source, please visit Bettersize Instruments Ltd.