It is easy to compare basic camera specifications like resolution, frame rate and interface. Comparing imaging performance of cameras like temporal dark noise, quantum efficiency and saturation capacity can be challenging. It is important to understand what these different measurements really mean.
How is signal to noise ratio different from dynamic range? What is quantum efficiency, and is it measured at the peak or at a specific wavelength? This article will explore these questions and explain how to compare and choose cameras based on the imaging performance data following the EMVA1288 standard.
EMVA1288 is a standard that defines the features of camera performance to measure, how to measure them and how to present the results in a unified way. The first part of this article will help to understand the different aspects of imaging performance of an imaging sensor.
The basic concepts which are crucial to understanding when considering how an image sensor converts light into a digital image and ultimately defines the performance of the sensor are discussed below. Figure 1 shows a single pixel and highlights these concepts.
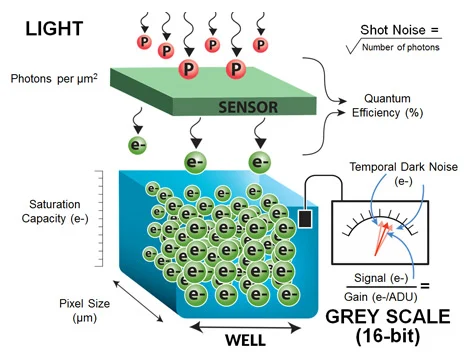
Figure 1. Image Credit: FLIR Systems
The noise inherent in the light itself is the first thing to understand. Light is made up of discrete particles, known as Photons, which are produced by a light source. There will be noise in the perceived intensity of the light as a light source produces photons at random times.
The physics of light states that the noise observed in the intensity of light is equivalent to the square root of the number of photons generated by the light source. This type of noise is known as Shot Noise.
It is worth considering that the number of photons seen by a pixel will depend on the light intensity and exposure time. This article will look at the number of photons as a combination of light intensity and exposure time.
In the same way, as it must be squared to establish the light sensitive area, Pixel Size has a non-linear influence on the light collection ability of the sensor. Converting the photons to electrons is the first step in digitizing the light.
This article does not explain how sensors do this, but it presents the measure of the efficiency of the conversion.
Quantum Efficiency (QE) is the ratio of electrons generated during the digitization process to photons. As 3 electrons are produced when six photons ‘fall’ on the sensor, the example sensor in Figure 1 one has a QE of 50%.
Electrons are stored within the pixel before being digitized. This is known as the well. The number of electrons which can be stored within the well is known as the Well Depth or Saturation Capacity. Additional electrons will not be stored if the well receives more electrons than the saturation capacity.
Once the pixel has completed light collection, the charge in the well is measured and this measurement is known as the Signal. The measurement of the signal in Figure 1 is represented by an arrow gauge. The error associated with this measurement is known as Read Noise or Temporal Dark Noise.
Lastly, Grey Scale is established by converting the signal value, expressed in electrons, into a 16-bit Analog to Digital Units (ADU) pixel value. The ratio between the analog signal value to digital greyscale value is measured in electrons per ADU and is referred to as Gain.
The gain of the ‘analog to digital’ conversion process should not be confused with the gain parameter as defined by the EMVA1288 standard. When assessing a camera’s performance, it is extremely common to refer to Dynamic Range and Signal to Noise Ratio.
These two measures of camera performance both consider the ratio of noise seen by the camera against the signal. Signal to Noise Ratio includes the root mean square (RMS) summation of the Shot Noise as well as the Temporal Dark Noise, while Dynamic Range only considers the Temporal Dark Noise.
The number of photons required to get a signal equivalent to the noise observed by the sensor is known as absolute sensitivity threshold. As it represents the theoretical minimum amount of light required to observe any meaningful signal at all, this is a vital metric.
FLIR created an industry-first comprehensive study of imaging performance of over 70 camera models to help compare sensors and cameras based on the EMVA1288 standard.
Table 1. Source: FLIR Systems
| Measurement |
Definition |
Influenced by |
Unit |
| Shot noise |
Square root of signal |
Caused by nature of light |
e- |
| Pixel size |
Well, pixel size… |
Sensor design |
µm |
| Quantum efficiency |
Percentage of photons converted to electrons
at a particular wavelength |
Sensor design |
% |
Temporal
dark noise
(Read noise) |
Noise in the sensor when there is no signal |
Sensor and camera design |
e- |
Saturation capacity
(Well depth) |
Amount of charge that a pixel can hold |
Sensor and camera design |
e- |
Maximum signal
to noise ratio |
Highest possible ratio of a signal to all noise included in that signal, including shot noise and temporal dark noise. |
Sensor and camera design |
dB, bits |
| Dynamic range |
Ratio of signal to noise including only temporal dark noise |
Sensor and camera design |
dB, bits |
Absolute sensitivity
threshold |
Number of photons needed to have signal
equal to noise |
Sensor and camera design |
Ƴ |
| Gain |
Parameter indicating how big a change in
electrons is needed to observe a change in
16 bit ADUs (better known as grey scale) |
Sensor and camera design |
e-/
ADU |
Comparing Low Light Performance of Cameras
Applications like optical character recognition (OCR) and license plate recognition (LPR), where monochrome imaging is commonly utilized, and the amount of light that a camera can gather may be limited due to short exposure times, will be considered in this article.
Establishing the resolution, frame rate and field of view needed to solve an imaging problem are quite simple, but deciding if the camera will have sufficient imaging performance can be more challenging.
This challenge is usually solved by trial and error. In an example where a vision system designer establishes that a VGA camera with ¼’’ CCD running at 30 FPS is sufficient in the application, the initial tests may show that the camera has enough sensitivity at exposure times of 10 ms when the object is still.
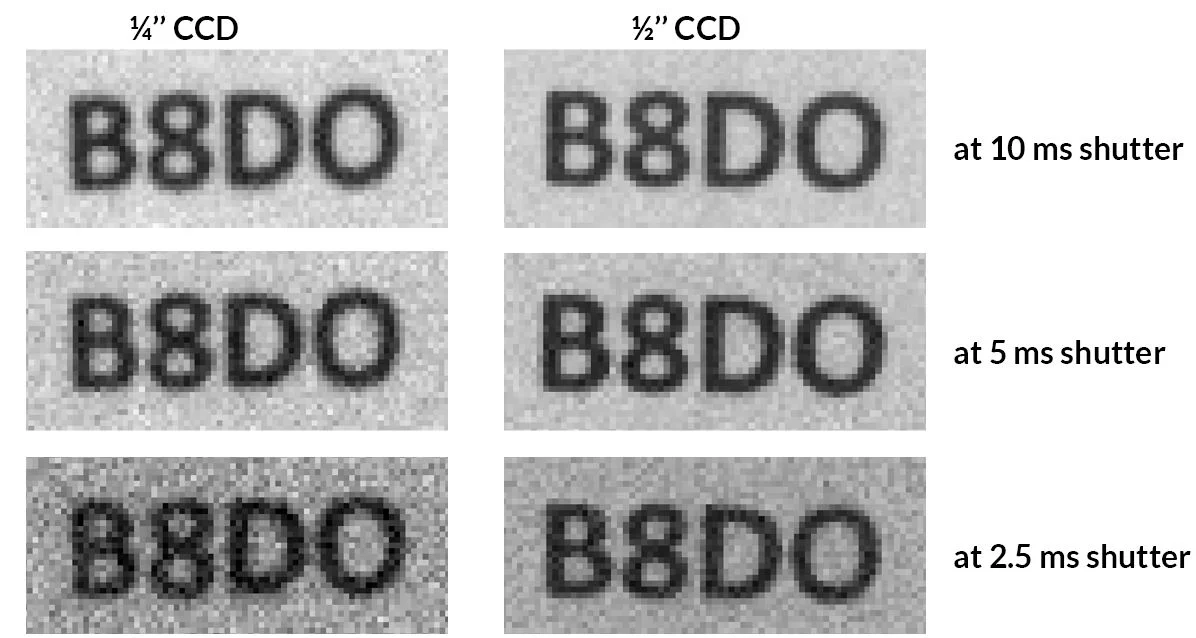
Figure 2. Results obtained from a 1/4'' and 1/2'' CCD cameras at different exposure times. Image Credit: FLIR Systems
Figure 2 demonstrates a simple example with characters B,8, D and 0 that can be easily confused by a vision algorithm. The top left image taken with a ¼’’ CCD camera generates images suitable which are suitable for image processing.
Yet, exposure times must be reduced when the object begins to move as the camera cannot provide useful information. This is because the numbers '8' and '0' cannot be distinguished from the letters 'B' and 'D.'
Deterioration of image quality is shown in the images in the middle and bottom left of Figure 2. Images unsuitable for image processing are produced, in particular at ¼’’ CCD at 2.5 ms exposure time.
For this example, the assumption is that a large depth of field is not needed and so the minimum F-number of the lens is acceptable, meaning it is not possible to gather more light by opening the shutter of the lens.
The designer must consider a different camera. The question is whether a different camera can enhance the system’s performance. A ½’’ sensor could be a good choice as utilizing a larger sensor has typically been accepted as a good way of solving low light performance problems.
Table 2. Source: FLIR Systems
| Camera |
Sensor |
Pixel Size (μm) |
Quantum Efficiency
(%) |
Temporal Dark Noise
(e-) |
Saturation Capacity
(e-) |
1/4’’ Camera
(FL3-GE-03S1M-C) |
ICX618 |
5.6 |
70 |
11.73 |
14,508 |
1/2’’ Camera
(BFLY-PGE-03S3M-C) |
ICX414 |
9.9 |
39 |
19.43 |
25,949 |
Considering the EMVA 1288 imaging performance of the camera can be useful instead of continuing with trial and error. When examining the EMVA 1288 data, it can be seen that the ¼'’ sensor has lower noise and better quantum efficiency, but that ½’’ CCD has a larger saturation capacity and larger pixel.
This article explains how to establish whether the ½’’ camera will perform better. By plotting the signal value versus the light density (photons/µm2) Figure 3 can compare the cameras. The signal as a function of light density is established by utilizing the following formula:
Signal = Light Density x (Pixel Size)2 x Quantum Efficiency
One crucial assumption that is made by this article is that the lenses have the same F-number, same field of view, and same camera settings.
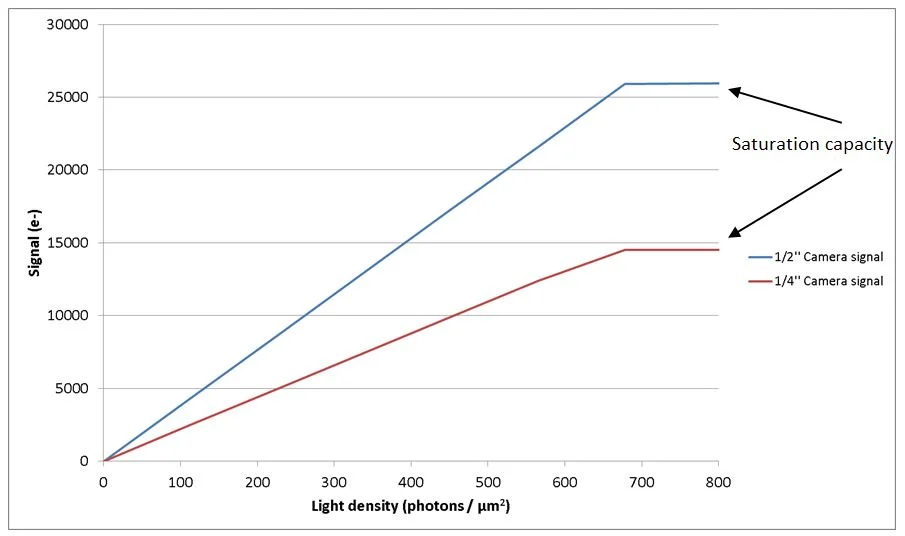
Figure 3. Signal produced by 1/4'' and 1/2'' CCD cameras as a function of the light level. Image Credit: FLIR Systems
The figure demonstrates that the ½’’ sensor will generate higher signal for the same light density. It can also be seen that saturation happens at a similar light density level of 700 photons/µm2, but the ½’’ sensor has significantly higher saturation capacity.
In the application that is being considered in this example, the comparison of cameras must be performed at low light level, which means that considering the noise levels becomes particularly important.
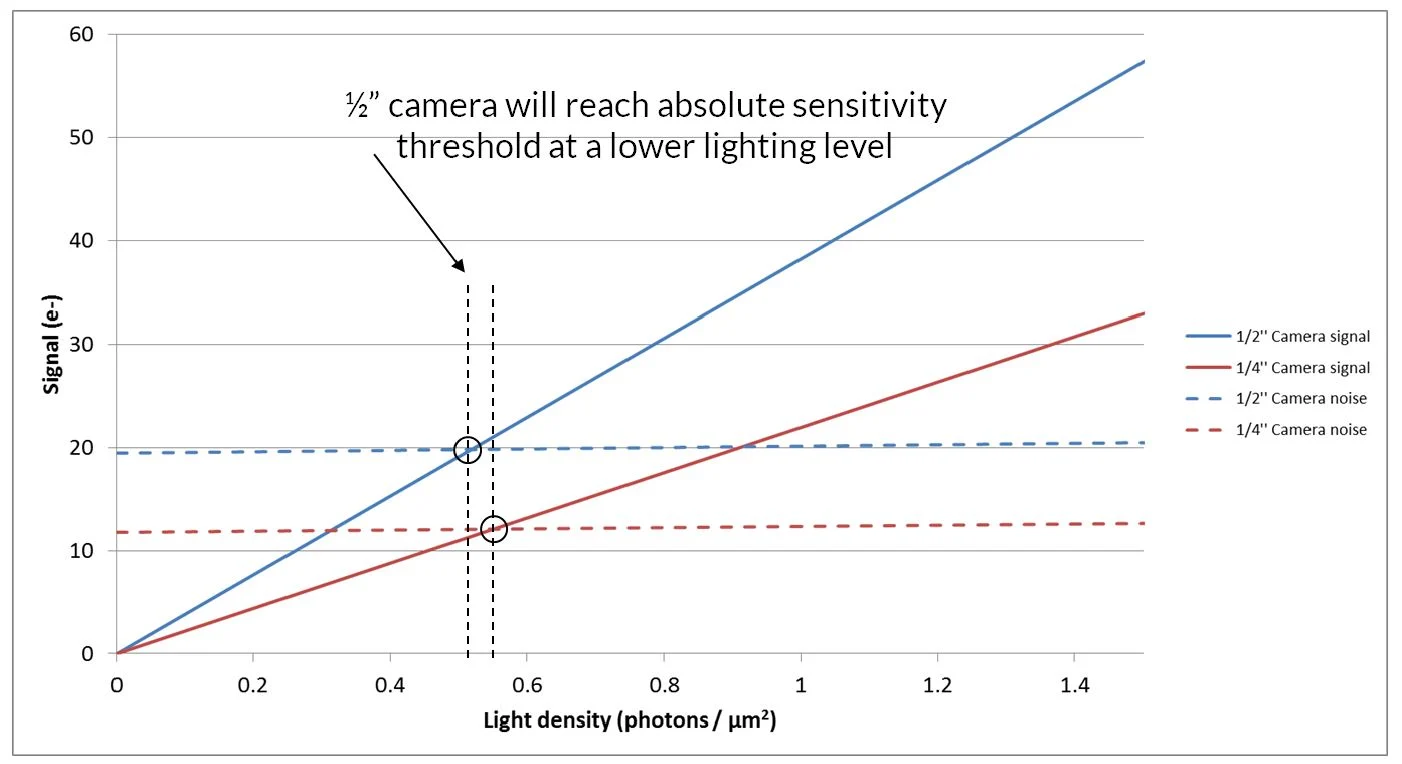
Figure 4. Signal and noise of the 1/4'' and 1/2'' CCD cameras at low light levels. Image Credit: FLIR Systems
The noise and signal are shown at low lighting levels in Figure 4. The noise presented in the figure is an RMS summation of Temporal Dark Noise and Shot Noise which was calculated by utilizing the below formula:

The graph demonstrates that the light level at which signal is equal to the noise, known as the absolute sensitivity threshold, is reached by the ½’’ sensor at a slightly lower level than that of the ¼'’ sensor. The signal to noise ratio (SNR) is the vital measure required to establish which camera will perform better in low light applications.
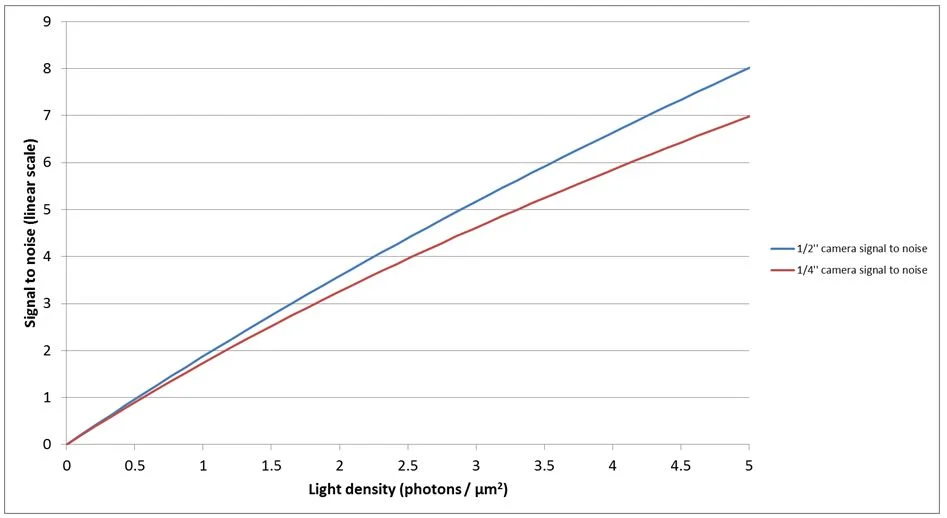
Figure 5. Signal to noise ration of the 1/4'' and 1/2'' CCD cameras at low light levels. Image Credit: FLIR Systems
The SNR of the two cameras as a function of lighting level is shown in Figure 5. Based on the higher signal to noise ratio of the ½’’ sensor, the theory suggests that the ½’’ cameras should perform better than ¼’’ cameras at low light levels.
It can be observed from the images in Figure 2 that at 2.5 ms exposure time, the ½’’ sensor preserves the shape of the characters at all exposure times, while the ¼’’ sensor makes it difficult to distinguish between characters. The ½’’ sensor, therefore, performs better, and the practical results are in-line with the theory.
FLIR has performed an extensive study of cameras and has published the EMVA 1288 imaging performance results. This information is useful to compare the performance of different camera models.
This study can be generally useful when comparing any two cameras with sensors that are covered in the document even though camera implementation does affect the imaging performance.
It should be considered that the technique outlined in this article is useful to get a general idea of how well a camera will perform compared to another. This technique can help to rule out cameras that are not likely to enhance the performance required, but the ultimate test of the performance of the camera is in the actual application.
Comparing a Traditional CCD with a Modern CMOS Sensor
The performance of a traditional CCD sensor will be compared to a modern CMOS sensor in a scene with a wide range of lighting conditions and in low light imaging conditions.
It was previously demonstrated that a camera with the Sony ICX414, a ½’’ VGA CCD, works better in low light conditions than a camera with the Sony ICX618, a ¼’’ VGA CCD. Next, the ½’’ VGA CCD will be compared with the new Sony Pregius IMX249, 1/1.2’’ 2.3Mpix global shutter CMOS sensor.
The cost of the cameras with these two sensors is comparable at approximately € 400, a VGA region of interest in the CMOS camera is actually nearer to the optical size of the ¼’’ camera and the frame rates are also similar at the VGA resolution.
The EMVA 1288 data for the cameras establishes that the IMX249 CMOS sensor has lower noise, much better quantum efficiency, and higher saturation capacity but the ICX414 CCD sensor has a larger pixel, which was the critical parameter.
Table 3. Source: FLIR Systems
| Camera |
Sensor |
Pixel Size (μm) |
Quantum Efficiency
(%) |
Temporal Dark Noise
(e-) |
Saturation Capacity
(e-) |
1/2" CCD Camera
(BFLY-PGE-03S3M-C) |
ICX414 |
9.9 |
39 |
19.43 |
25,949 |
1/1.2" CMOS Camera
(BFLY-PGE-23S6M-C) |
IMX249 |
5.86 |
80 |
7.11 |
33,105 |
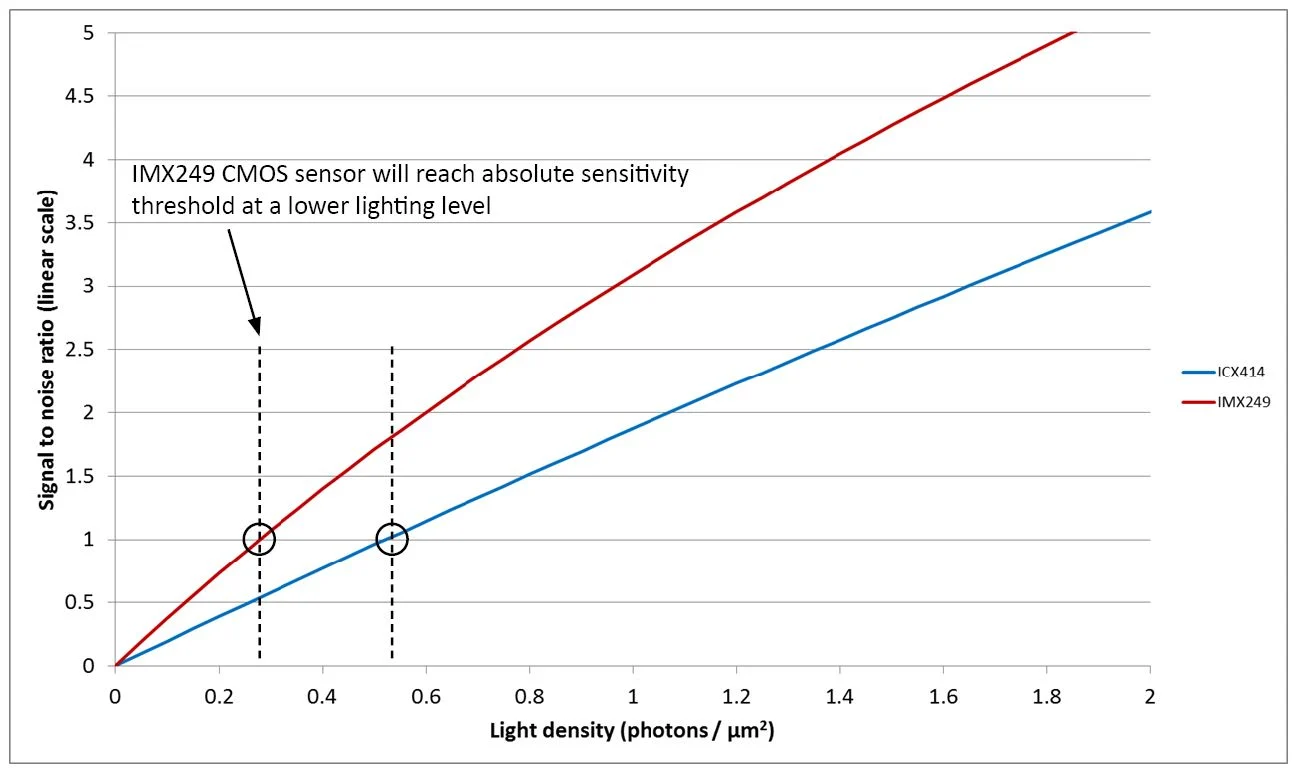
Figure 6. Signal to noise ratio of the ICX414 CCD and IMX249 CMOS sensors at low light levels. Image Credit: FLIR Systems
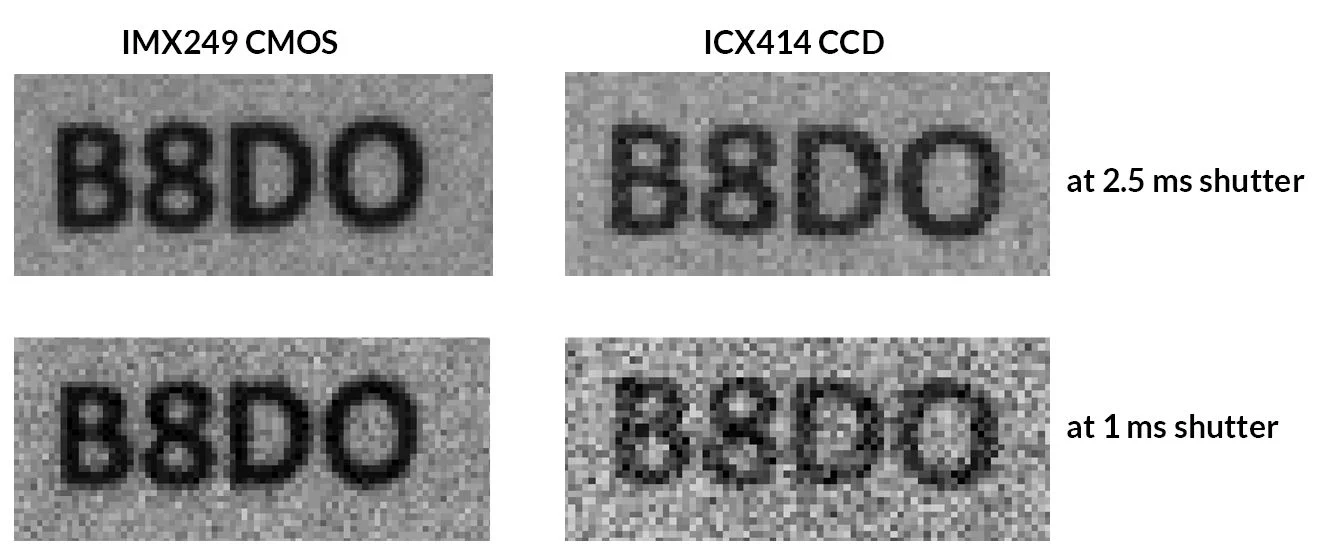
Figure 7. Results obtained from the ICX414 CCD and IMX249 CMOS sensors at different exposure times. Image Credit: FLIR Systems
The first conclusion is that the image generated by the ICX414 CCD sensor would be brighter than the image generated by the IMX249 CMOS sensor. If this is not obvious from the graph, it is worth considering that the image would be produced at around 700 photons/µm2.
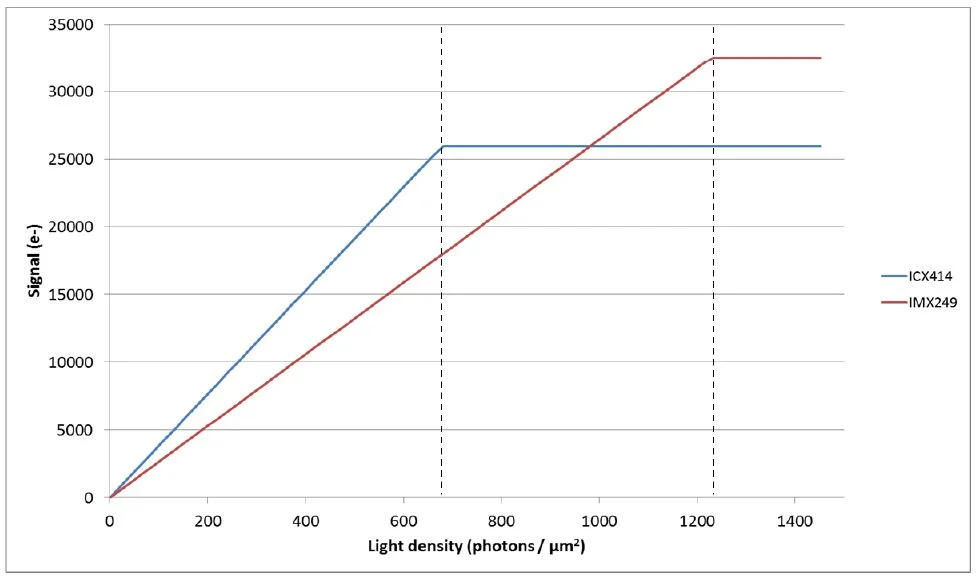
Figure 8. Signal produced by the ICX414 CCD and IMX249 CMOS sensor as a function of the light level. Image Credit: FLIR Systems
The image should be at the highest grayscale level, most likely saturated for the ICX414 CCD sensor, while the IMX249 CMOS sensor would generate an image that is just over 50% of the maximum brightness.
As a naïve approach to assessing camera sensitivity is by observing the brightness of the image, this observation is significant. The assumption is that a brighter image will be produced by a camera that has better performance.
However, this is not true, and it is actually the opposite in this example as the camera which produces darker images actually has better performance. The second observation is that the IMX249 CMOS sensor will generate images that are useful for image processing in a larger scope of lighting conditions.
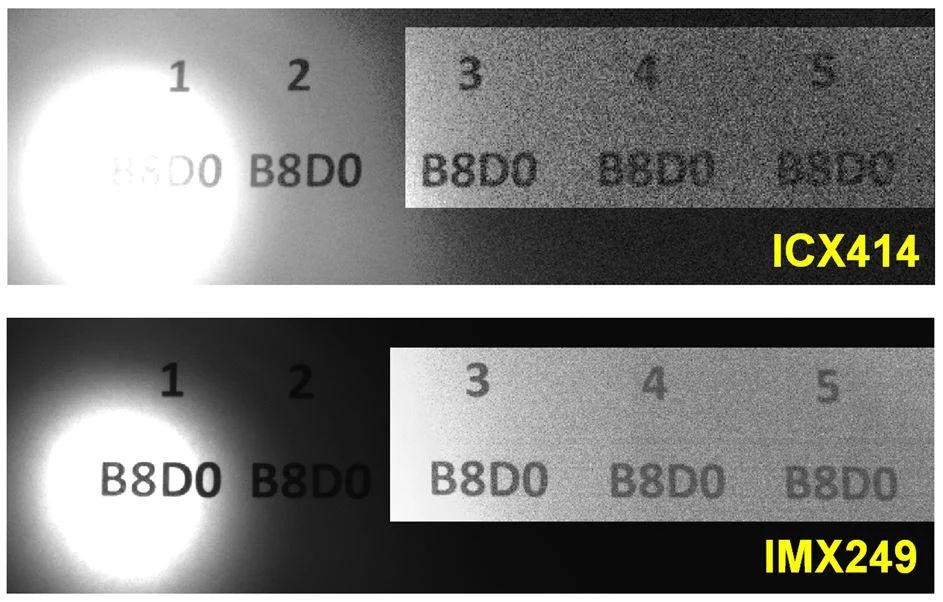
Figure 9. Results obtained with the ICX414 CCD and IMX249 CMOS sensors under difficult lighting conditions. Image Credit: FLIR Systems
The same scene imaged by the two cameras is shown in Figure 9. The underlying data was not modified, but it should be noted that the darker portion of the images has been enhanced for display purposes.
It can be seen from the images that the ICX414 CCD is saturated in the bright areas of the scene, while at the same time, the dark areas have too much noise for the characters to be legible. On the other hand, the IMX249 CMOS sensor produces legible characters in the bright and dark parts of the scene.
It can be concluded that in machine vision applications, the recent global shutter CMOS technology is becoming a viable alternative to CCDs.
The sensors have higher frame rates at equivalent resolutions, are less expensive and do not have artifacts like smear and blooming, and they are also beginning to exceed the imaging performance of CCDs.
Conclusion
In this article, the key concepts utilized in assessing camera performance were demonstrated. The EMVA1288 standard was introduced and the results were applied to compare camera performance under various lighting conditions.
When evaluating cameras, there are still numerous aspects of camera performance that can be considered. For instance, quantum efficiency alters dramatically at different wavelengths, so when the light source is at near infra-red (NIR) frequencies, a camera that performs well at 525 nm may not perform nearly as well.
Long exposure times, which are common to fluorescence and astronomic imaging, must consider the effects of dark current, a type of noise that is vital at extremely low light levels.

This information has been sourced, reviewed and adapted from materials provided by FLIR Systems.
For more information on this source, please visit FLIR Systems.