Variability must be avoided for OEM instrument developers who must guarantee an answer based on the quality of a Raman spectrum. These answers are important to their customers and those influenced by the decisions made based upon those outputs.
By design, a good-quality OEM spectrometer should demonstrate low unit-to-unit variability from the start, and any remaining small differences must be corrected to acquire the most repeatable and robust and analytical outcomes in the field.
This article demonstrates a technique that can be used to correct for slight variations in the wavenumber and intensity response of multiple units, achieving over 99.5 % agreement between any two spectrometers across seven Raman spectrometers of the same configuration and model.
The Need for Reproducibility
Application-specific instruments based on Raman designed by original equipment manufacturers (OEMs) must provide reliable, consistent answers, regardless of the serial number of the unit or in which country it is being used.
While sample handling, method development and algorithm development are key to achieve this, Raman applications are also dependent on a high degree of unit-to-unit reproducibility of the actual instrument.
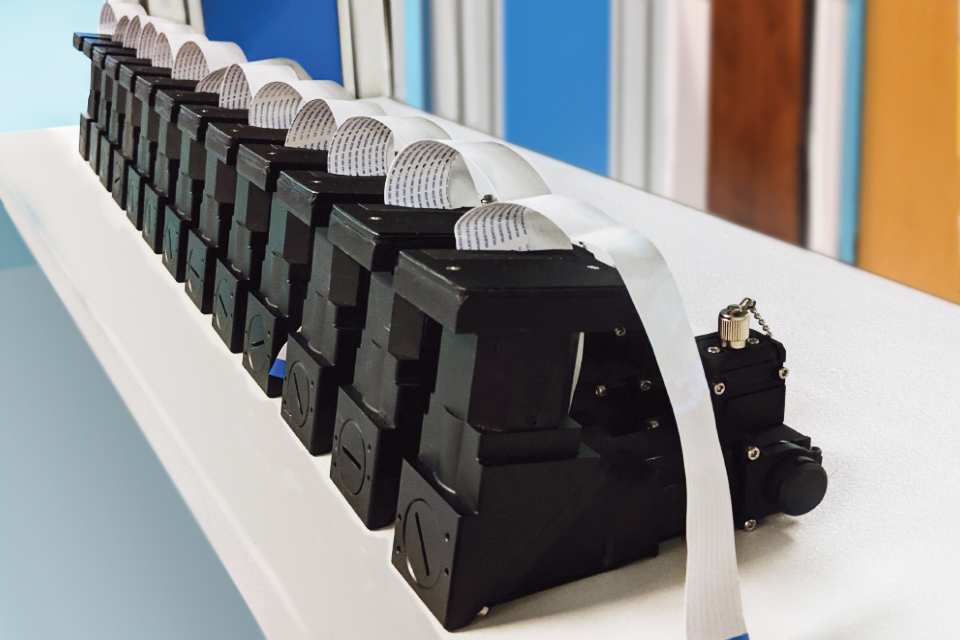
Image Credit: Wasatch Photonics, Inc.
With various mechanical, optical and electronic parts in each instrument, there will always be some unavoidable differences in their spectral response when built in volumes of 10, 100, or 100,000 – no matter how carefully aligned or how exacting the quality control. The best way to ensure that the same spectrum is collected from many instruments when each unit is individually aligned and optimized is outlined below.
Making Reproducibility a Reality
By using a good optical design some degree of variability can be eliminated. For instance, the all-transmission optical design of Wasatch Photonics spectrometers yields a very low sensitivity to small alterations in the alignment angles.
Combined with the consistent nature of the VPH gratings used, these designs yield a high degree of reproducibility out of the box. This is why all-transmission spectrometer designs are preferred by many OEMs over the replicated gratings, reflective optics, and asymmetrical, folded optical path used in crossed-Czerny Turner spectrometers.
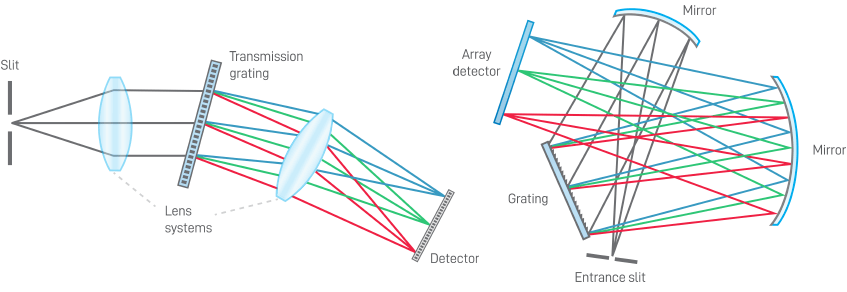
All-transmission spectrometer with VPH grating (left). Crossed Czerny-Turner spectrometer with reflective optics and ruled grating (right). Image Credit: Wasatch Photonics, Inc.
Small differences in the spectral sensitivity and the wavenumber axis are still present, even with the best possible design and good manufacturing practices. Removing these minor differences can result in a significant improvement in the overall unit-to-unit reproducibility for Raman applications like spectral matching to a common library, and ultimately, can lead to consistent spectral analyses with any instrument.
There are just two corrections required to eliminate these minor spectrometer differences almost fully, resulting in an excellent unit-to-unit reproducibility to satisfy even the most demanding OEM applications.
One-Time Factory Calibration and Daily Correction
The US Pharmacopoeia1 for Raman instruments outlines three crucial areas of importance for the proper calibration of a Raman spectrometer: the primary wavelength (x-axis), the intensity (y-axis) and the laser wavelength.
Wavelength Calibration
Array detector instruments, like Wasatch Raman spectrometers, record the signal intensity as a function of the position on the array detector as measured with the pixel index.
The translation from pixel index intrinsic to the array detector to the light’s wavelength is based on the wavelength calibration carried out in the factory during production with calibration light sources, utilizing very sharp, well-defined, atomic emission lines.
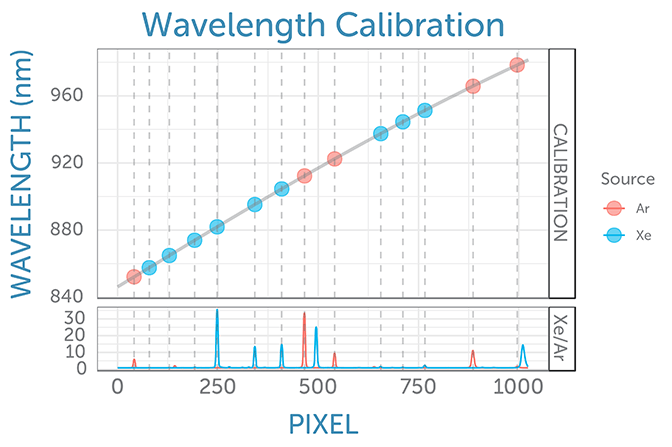
Polynomial fit of known atomic emission wavelengths as a function of measured peak positions in pixel space constitutes the wavelength calibration. Image Credit: Wasatch Photonics, Inc.
Throughout calibration, the position of a predefined set of emission peaks is established in pixel space and the known emission wavelengths are fit with a polynomial function as a function of these measured pixel positions.
When the spectrometer is connected to the computer, the resulting calibration coefficients are saved in the spectrometer’s EEPROM to be read and applied. Users can check the accuracy of the wavelength calibration with suitable atomic emission sources. However, the actual calibration should only be carried out at the factory.
Relative Intensity Calibration
For Raman spectra, a calibration of the intensity axis is needed to achieve reproducible peak height ratios. All spectrometers are aligned individually and optimized during production, and while Wasatch Photonics’ own transmission optics result in extremely low sensitivity to alignment parameters, small differences in the overall spectra response of different spectrometers are still present.
The intensity calibration is carried out according to ASTM E2911-13 (2013)2 with a standard reference material sample (SRM), which emits a broadband fluorescence spectrum of a well-known shape when illuminated with the Raman laser.
Raman SRM materials are usually a solid block of glass of well-known composition, and are much easier to utilize than the radiometric calibration lamps or ‘gold standards’ employed in UV-VIS-NIR spectroscopy.
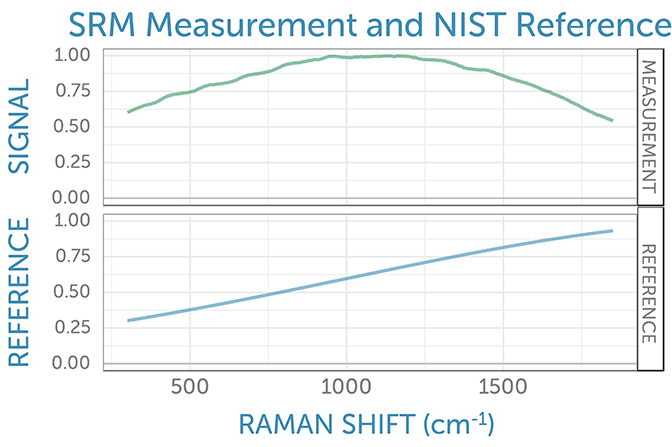
Example of the measured and the published spectral shape of the emission from a SRM standard. Image Credit: Wasatch Photonics, Inc.
The SRM’s measured emission spectrum is compared to the expected emission spectrum, and the ratio between the two spectra defines the spectral intensity correction factor at each pixel.
This calibration is carried out in production at the factory, during which the smooth spectral response curve of the spectrometer is fit to a functional form. The spectral response profile parameters are saved in the spectrometer’s EEPROM where they can be read by the software to apply the intensity correction.
Users can check the accuracy of the intensity correction with the intensity ratio of two peaks of a reference substance, such as those published in ASTM 1840-96 (2014)3.
The peak height ratio for two peaks in a Raman spectrum can also depend on the optical resolution (linewidth) of the instrument, for instance for a compact Raman system with limited optical resolution. As the area under the curve for each spectral line remains constant, if lower resolution broadens a peak, it also reduces peak height.
When comparing experimental peak height ratios to literature values measured with high-resolution benchtop instruments, this must be considered.
Laser Wavelength Calibration
The final calibration which should be carried out at the factory is the determination of the exact excitation laser wavelength. Lasers with a given (nominal) Raman wavelength are specified to fall within a wavelength range of typically ± 0.5 nm. At a Raman excitation wavelength of 830 nm corresponds to a Raman shift of approximately 7 cm-1.
The exact laser wavelength should be established by utilizing the well-known Raman peaks of a reference substance for best accuracy, ideally one that is published in ASTM 1840-96 (2014)3, for which the peak positions are defined to be accurate to within 1 cm-1.
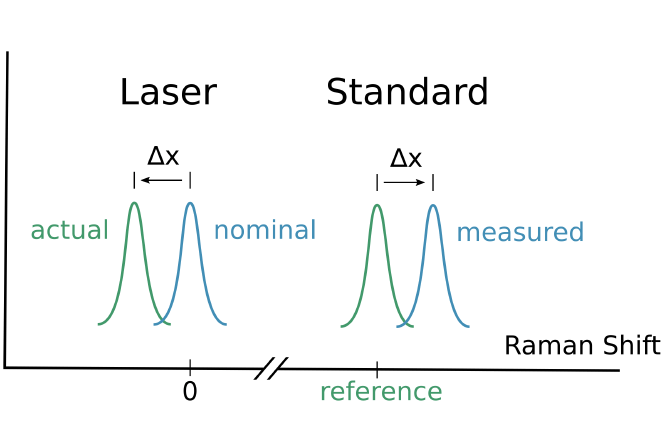
Calibration of the laser wavelength using the deviation of a measured Raman peak position (assuming the nominal laser wavelength) to the reference peak position. Image Credit: Wasatch Photonics, Inc.
The average difference between the known peak positions and the measured peak positions of the reference substance supplies the deviation of the laser wavelength from the nominal laser wavelength.
For spectrometers with built-in lasers sourced from Wasatch Photonics, to determine the Raman shift from the wavelength calibration, the measured laser wavelength is written to the spectrometer’s EEPROM and is utilized by the software.
It should be considered that if the laser and spectrometer are sourced independently, this laser wavelength calibration has to be carried out at the OEM site.
The user can check the accuracy of the laser wavelength once in the field by comparing measured Raman peak positions to the reference peak positions. As described in the next section, it is recommended to validate and adjust this Raman axis correction each day.
Day-to-Day Wavenumber Correction
It is necessary to account for the small, but noticeable, day-to-day overall differences in the entire system to achieve the highest accuracy spectroscopic measurements. This correction to the final wavenumber axis captures any minor alterations in the spectrometer wavelength calibration, laser wavelength, or other small shifts of the spectrum, due to external temperature changes for instance.
Raman instruments at every performance level have demonstrated a need for day-to-day correction to attain reliable standardization of Raman spectra for the transfer of spectral libraries across instruments.4
This correction is carried out using a single, additive, wavenumber offset which is established completely analogous to the laser wavelength calibration previously outlined.
The average deviation between the known Raman peak positions to the peak positions measured for this day-to-day reference standard is used as an additive correction to the full Raman spectrum.
Usually, this correction is carried out by utilizing a reference standard like polystyrene, in compliance with USP chapter <1120>5 or EP chapter <2.2.48>6. The corrected wavenumber axis resulting then gives high Raman shift accuracy and so, excellent unit-to-unit reproducibility of peak positions.
Example Calibration and Correction
With a complete understanding of the technique, it is now possible to demonstrate the intensity calibration and wavenumber correction for a set of seven different, but identically configured and designed, 830 nm Raman systems with integrated laser and probe optics (WP 830-L).
A sample solution of glucose in water inside a polystyrene cuvette is inserted into the sample holder, which in turn is directly attached to the front lens of the spectrometer. Due to the complex nature of its Raman spectrum with multiple peaks over a wide wavenumber range, glucose in water was selected as the demonstration sample.
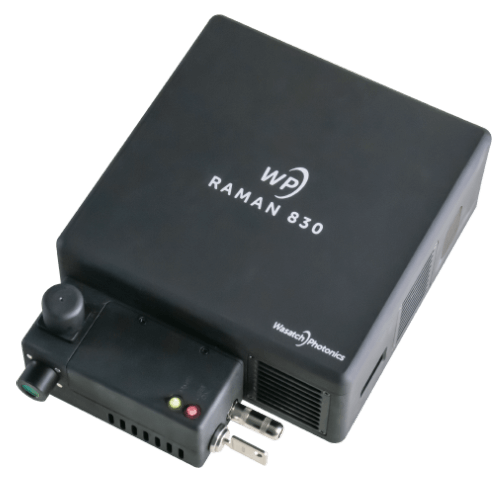
Image Credit: Wasatch Photonics, Inc.
Wavelength Calibration
The wavelength calibration is used as is and has been carried out during production.
Wavenumber Correction
The sample solution which is utilized in this example is contained in a polystyrene cuvette, a material that is listed as one reference compound in the ASTM publication3.
Two polystyrene peaks at 1001.4 cm-1 and 1602.3 cm-1 (ASTM) are utilized as the wavenumber reference because these peaks are separated sufficiently from any sample peaks happening as a result of the glucose in water.
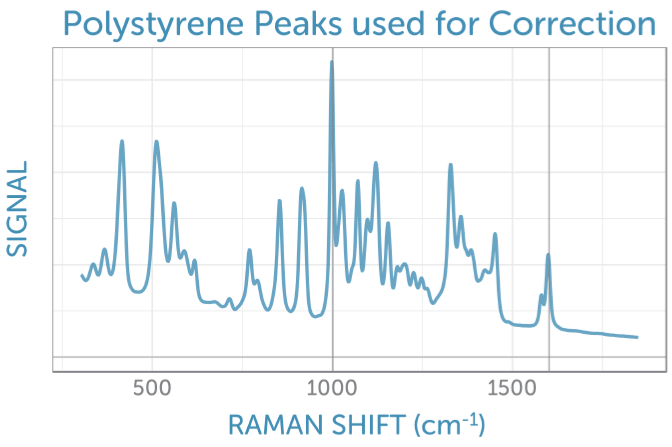
Example spectrum of glucose solution in a polystyrene cuvette. The polystyrene reference peaks are marked with vertical lines. Image Credit: Wasatch Photonics, Inc.
Depending on the unit, the resulting average wavenumber correction shift values vary from -4 cm-1 to +2 cm-1. Most of this adjustment was a result of the utilization of the nominal laser wavelength (830.0 nm) in the original acquisition.
The position of any glucose peak from any of the seven test spectrometers deviates by less than 0.5 cm-1 from the mean position after this wavenumber correction, which is lower than a quarter of a pixel on the array detector, and demonstrates the high accuracy of the wavelength calibration.
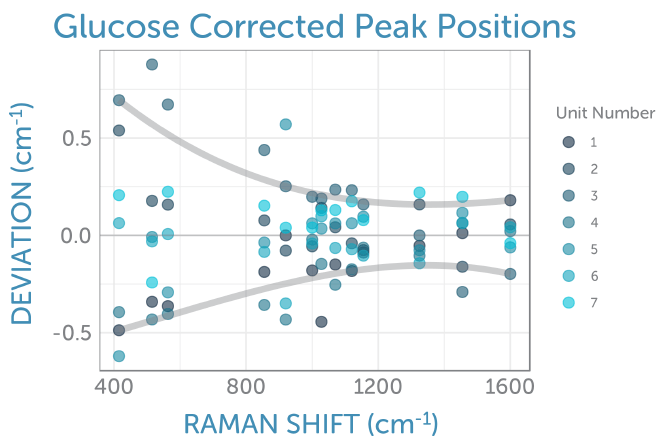
Deviation of glucose peak positions for individual spectrometers from the mean position across all spectrometers indicates a very narrow spread of less than 0.5 cm-1 or less than 0.25 pixels. Image Credit: Wasatch Photonics, Inc.
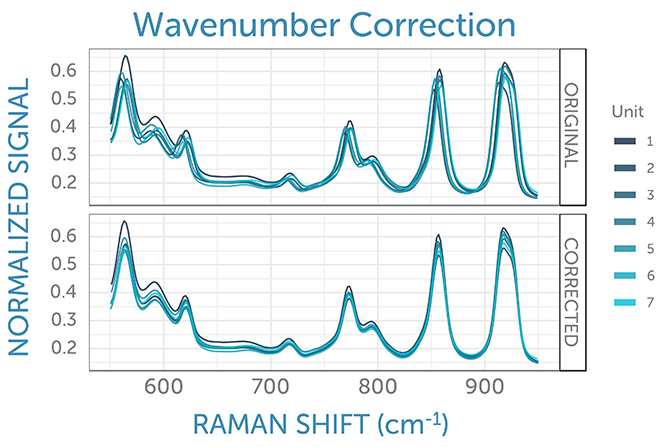
The wavenumber correction results in a significant improvement in the agreement of peak positions between the sample spectra recorded with different spectrometers.
Example of the measured and the published spectral shape of the emission from a SRM standard. Image Credit: Wasatch Photonics, Inc.
Relative Intensity Calibration
The emission from a standard reference material sample specific to the 830 nm laser wavelength (SRM 2246) was measured as a demonstration of how to carry out the intensity calibration.
A complete list of available relative intensity correction standards for Raman spectroscopy can be found at the NIST website SRM Home and ASTM E29111-13 (2013)2.
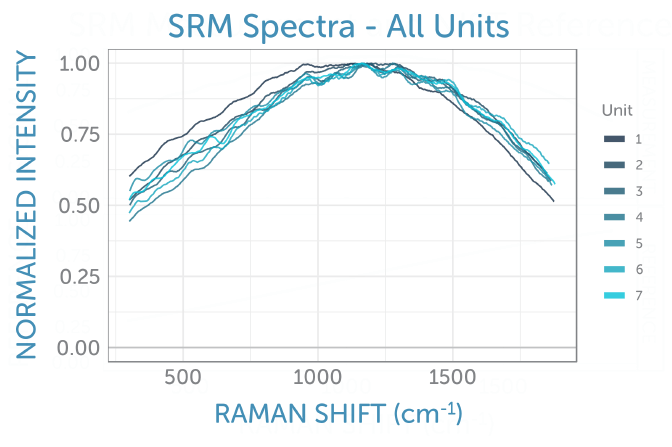
Normalized emission spectra from SRM 2246 as recorded with all spectrometers in test. Image Credit: Wasatch Photonics, Inc.
For each individual WP 830-L spectrometer, the emission spectrum for SRM 2246 was measured, normalized and compared to the expected (normalized) emission spectrum as specified by NIST.
The spectral sensitivity curves of the individual spectrometers agree very well, even without intensity calibration, which demonstrates the high reproducibility of the all-transmission design of the spectrometer. The ratio between expected emission and measured emission constitutes the intensity calibration (at each pixel).
Applying this intensity calibration to all experimental spectra eliminates the spectrometer-specific spectral sensitivity, resulting in an excellent agreement in the relative peak heights across multiple spectrometers. All spectra were normalized to a single peak maximum for best comparison of the relative peak heights.
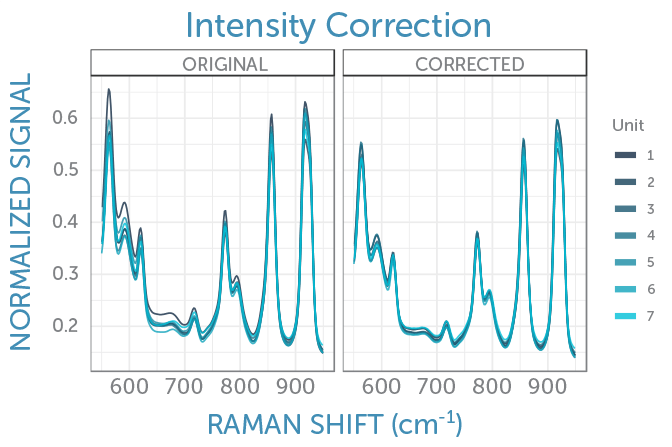
Comparison of a section of the (normalized) sample spectrum (glucose in water) for seven spectrometers with wavenumber and intensity correction (right) and without intensity correction (left). The intensity correction leads to an excellent agreement of all peak heights. Image Credit: Wasatch Photonics, Inc.
Results: High Correlation Between Spectra
To quantify the agreement between the corrected spectrometers, the Pearson’s correlation coefficient between the spectra from each possible pairing of spectrometers within the group was determined after interpolation to a common wavenumber axis with 1 cm-1 spacing.
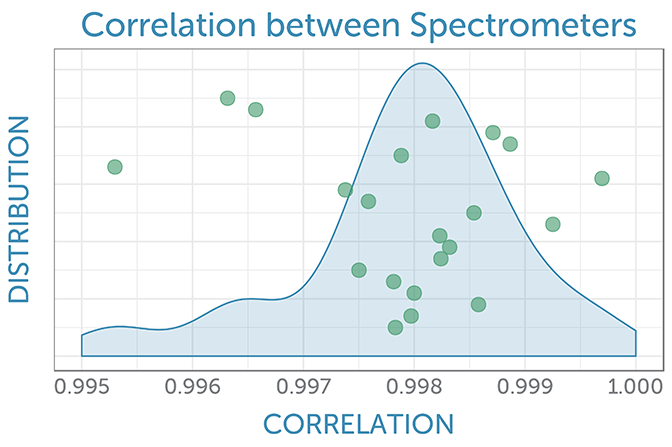
Distribution of the spectral agreement for all pairwise comparisons of the corrected sample spectrum recorded with two different spectrometers. Image Credit: Wasatch Photonics, Inc.
This correlation coefficient is frequently utilized as the “hit quality index” in library matching and measures the general agreement between different spectra. Twenty-one pairwise correlation coefficients were found for the seven spectrometers in this group.
A very high agreement between any two (corrected) spectra was found, with a minimum correlation of 99.5 % and a typical pairwise correlation of 99.8 %. This shows the excellent agreement between Raman spectrometers, which can be achieved by beginning with a good optical design and applying the appropriate corrections.
Conclusion
In order to supply dependable, consistent answers in the field, OEM applications demand a high degree of unit-to-unit agreement between individual spectrometers. Yet, even identically designed, configured and calibrated spectrometers experience some variation in their spectra because of their complex optics.
This can be corrected easily and effectively through intensity and wavenumber corrections, standardizing the response of all units before application-specific analysis of the spectra.
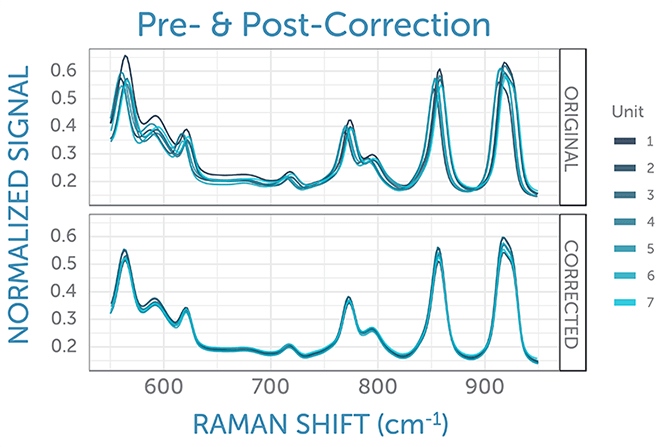
Image Credit: Wasatch Photonics, Inc.
By beginning with a robust, sensitive Raman spectrometer design and applying these simple corrections, it is demonstrated that any two spectrometers of the same configuration can be made to measure the same complex spectrum with excellent overall agreement.
This straightforward correction process makes it viable to utilize universal chemometric models or common matching libraries for complete series of spectrometers with high accuracy.
Wasatch Photonics works together with OEM customers at each stage of the development process to integrate their ‘OEM by design’ solutions and best manufacturing practices for Raman applications. The company uses its unique instrument design expertise, applications expertise, and market knowledge and reach to create robust, sensitive and reproducible instruments.
References
- European Pharmacopeia 8.7 Edition 2016, Chapter 2.2.48, European Directorate for the Quality of Medicines & Healthcare, 2016.
- ASTM E2911-13, Standard Guide for Relative Intensity Correction of Raman Spectrometers, ASTM International, West Conshohocken, PA, 2013.
- ASTM E1840-96(2014), Standard Guide for Raman Shift Standards for Spectrometer Calibration, ASTM International, West Conshohocken, PA, 2014.
- Rodriguez JD, Westenberger BJ, Buhse LF, Kauffman JF. “Standardization of Raman spectra for transfer of spectral libraries across different instruments.” Analyst. 2011;136(20):4232-40.
- USP 43-NF 38 General Chapter <1120>, The United States Pharmacopeial Convention, 2020.
- European Pharmacopeia 8.7 Edition 2016, Chapter 2.2.48, European Directorate for the Quality of Medicines & Healthcare, 2016.
Acknowledgments
Produced from materials originally authored by Dr. Dieter Bingemann from Wasatch Photonics.

This information has been sourced, reviewed and adapted from materials provided by Wasatch Photonics, Inc.
For more information on this source, please visit Wasatch Photonics, Inc.