Coatings and paints are formed of intricate blends of various components, including binders, pigments and solvents, along with other components like curing, anti-foaming and dispersing agents.
Every component plays an important role in dictating the overall quality of the paint, its performance both during and after application, as well as its durability, adhesion, strength, stability, gloss, impact resistance and leveling. Paints display complex flow behavior and, as a result are considered highly- structured particle dispersions.
It is expected that, over its lifetime, paint will be exposed to a number of different shear environments and shear rates. Paint experiences low levels of shear during storage and transport (as low as <1 s-1) and needs to have a high, solid-like viscosity and even display a yield stress to prevent phase separation.
The energy and pumpability needed for transport and mixing during processing directly correlates with its viscosity at medium-to-high shear rates (10 to 1000 s-1). The paint will finally be subjected to high shear rates (>100 s-1) during application (rolling, brushing, spraying and so on), where it is expected to behave as a free-flowing and relatively low viscosity liquid.
The complex flow behavior of paint cannot be fully captured by a simple single-point viscosity measurement. In order to properly examine its overall performance, paint needs to be assessed by a complete suite of rheological tests.
The rheological behavior of a commercial paint product was assessed with the Thermo Scientific™ HAKKE™ MARS™ iQ Rheometer. This consisted of three fundamental tests: stepped shear rate viscosity profile, thixotropy loop and shear recovery. These three specific test methods help to simulate the processing and application of the paint, as well as help further optimize and evaluate final product formulations.
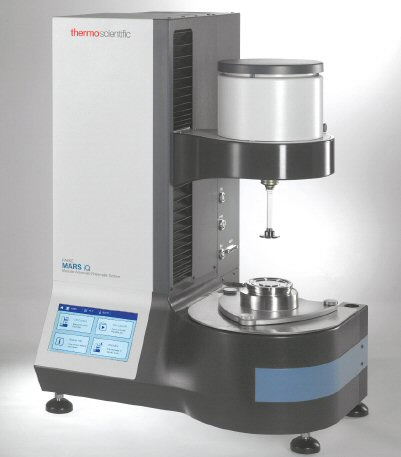
Figure 1. HAAKE MARS iQ Rheometer with Peltier plate temperature control for use with parallel-plate and cone-and-plate geometries. Image Credit: Thermo Fisher Scientific – Materials & Structural Analysis
Materials and Methods
Using the HAAKE MARS iQ Rheometer with mechanical bearing, commercially available water-based wall paint was examined (Figure 1). In order to control temperature at 20 ± 0.1 °C, the Peltier plate temperature module was used. Making use of the 60 mm diameter parallel-plate geometry, the samples were then tested.
The gap height was able to be set and maintained at 0.3 mm during all measurements due to the automatic lift and precise gap control of the MARS iQ measuring head. The smaller gap height cut down on the necessary amount of sample volume (~0.9 mL) and allowed higher shear rates to be obtained whilst reducing sample ejection or migration from between the plates during testing.
In order to investigate the rheological behavior of the paint, three common test methods were used: 1) stepped shear rate profile, 2) thixotropy loop and 3) three-step shear recovery.
To measure the paint’s viscosity over four orders of magnitude in shear rate, the stepped shear rate profile was employed. Until the torque response changed by less than 2%, the shear rate was increased in a stepwise fashion from 0.1 to 4000 s-1 (holding each shear rate constant). At this point, the sample was then considered to have reached steady state, so the instrument was able to move to the next shear rate in the predetermined shear rate value window.
The instrument continued through this entire predetermined range while waiting for the sample to reach steady state at each shear rate (the latter is a time-independent measurement). Then, the measured viscosity (η) was plotted as a function of input shear rate (γ).
The thixotropy loop experiment requires a controlled rate (CR) ramp from low to high shear rates, which is subsequently followed by a shear rate hold (performed at the highest shear rate) and then an identical CR ramp back to the starting shear rate 2. The shear rate here was ramped from 0 to 100 s-1 over 100 s and subsequently held constant at the maximum shear rate of 100 s-1 for 30 s. Next, over the same 100 s time period, the shear rate was then reduced back to zero.
In order to quantify the thixotropic behavior of the material, the hysteresis area between the ramp up and the ramp down curves was calculated. A material which is non-thixotropic or non-shear history-dependent would therein display identical viscosity curves for the ramp up and ramp down and would not have a hysteresis area.
In contrast, the more a material is considered thixotropic and dependent on its shear history, the larger the hysteresis area. The hysteresis area is not an absolute measure for thixotropy, nor is it considered a true material property, given that the hysteresis area depends strongly on the input experimental parameters, like the shear rate range and time.
However, if they are examined using the same thixotropy procedure with identical test settings, different materials can be compared to one another. When calculating additional material properties, rheological models can also be fitted to the thixotropy loop data. The popular Casson model was applied in this instance to calculate the paint sample’s yield stress.
One of the thixotropy loop experiment’s major disadvantages is that it is unable to offer information on a material’s recovery time after exposure to a high shear rate. On the other hand, the three-step shear recovery test can be used to measure a material’s viscosity and how it changes over time after exposure to a high shear.
A relatively low shear stress (τ) of Pa was applied for 30 s during the first step, and the initial viscosity of the sample was measured while keeping the internal structure intact. Following this, in order to fully break down its microstructure, the sample was exposed to a comparatively high shear rate of 100 s-1 for 30 s. Subsequently, the applied shear was reduced immediately back to a constant stress of 8 Pa, and the change in sample viscosity was observed for 90 s. The final step is used to monitor how fast – and to what extent - a sample recovers after shearing. Step 1 and Step 3 can be performed using a low applied shear rate (using the CR mode).
However, the sample cannot be considered fully at rest when applying even a low shear rate, and as a result, its microstructure and apparent recovery will be influenced. It is therefore strongly recommended that the stress control mode is used to perform the first and final steps. Overall, the resulting viscosity of the sample was displayed as a function of time across all three steps.
Results and Discussion
The investigated commercial paint sample, as anticipated, displayed significant shear thinning behavior and showed nearly a three order of viscosity magnitude reduction across the explored shear rate range of 0.1 to 4000 s-1 (Figure 2). The initial viscosity of the paint was relatively high – a viscosity of 200 Pa·s – and this continued to decline as the shear rate was increased, showing a final viscosity of 0.5 Pa·s. Paints are complex particle dispersions which often show shear thinning behavior.
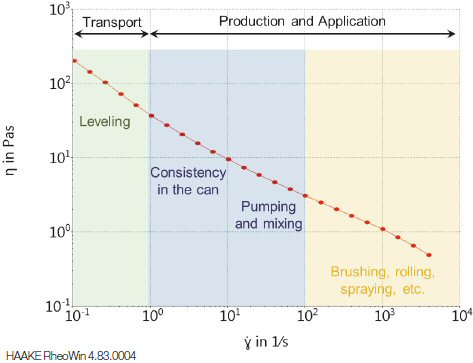
Figure 2. Paint viscosity as a function of applied shear rate. The different material behaviors and shear regimes from transport to production and application are displayed on the plot. Image Credit: Thermo Fisher Scientific – Materials & Structural Analysis
Shear thinning occurs as a result of shear-induced orientation, along with disaggregation of particles in the flow direction. The further dispersion and alignment of particles causes the internal friction to decrease and resulting in an overall viscosity reduction with increasing shear rate.
The performance of paint is determined by its shear thinning behavior; as a result, products are created with such ideal flow behavior in mind. When paint is exposed to low shear conditions such as those experienced in storage and transport (mainly due to gravity), having a high viscosity helps ensure product consistency, preventing particles from settling out of suspension (i.e., phase separation).
A higher viscosity at low shear is also beneficial after paint has been applied to a vertical service like a wall as it helps prevent the paint from running or streaking. In contrast, however, under the intermediate shear conditions during processing, the paint should exhibit a medium-to-low viscosity and be readily flowable, which makes it easier to mix, pump, transport, etc.
The paint should be even lower in viscosity under high shear application, ensuring that it is simple and straightforward to apply with rollers and brushes and should even be able to be sprayed through a nozzle. It is essential to study the paint behavior over a broad, shear-rate range in order to assess its true quality over its entire lifespan, from storage to its final use.
Considering and analyzing paint viscosity in response to applied shear is only a small part of the overall picture when analyzing full and complete product performance. For instance, a major question remains, namely: how does a specific paint recover after it has been exposed to an elevated shear rate? Once the paint has been applied to a wall, does the paint stay as a low-viscosity liquid, or does it change back into, under the low-shear forces of gravity, a high-viscosity material?
Paint can drip down the wall leaving streak marks or droplets after the paint has fully cured if it remains an easily flowable liquid for too long. Yet, the paint will risk showing brush or roller marks (resulting in a textured or uneven final coating) if it recovers too quickly. It is, therefore, essential to use the thixotropy loop and shear recovery tests to gauge and uncover these time-dependent behaviors.
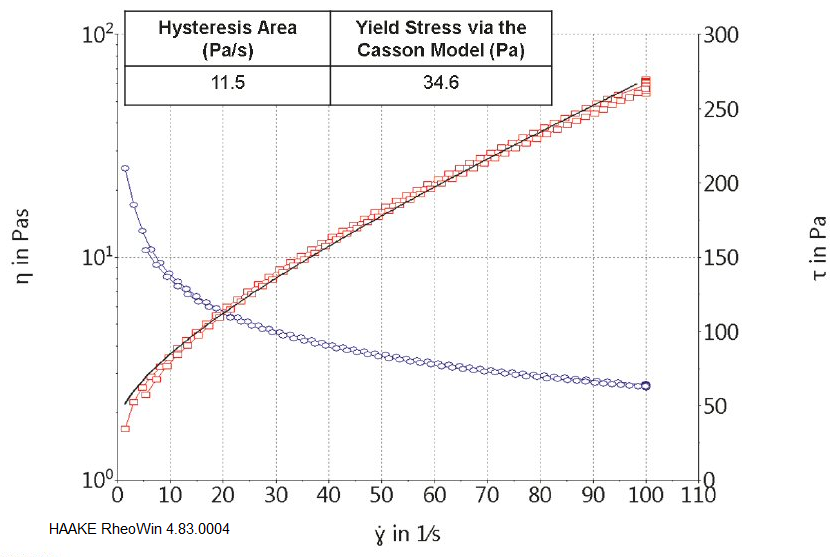
Figure 3. Paint viscosity (circles; left y-axis) and resultant shear stress (squares; right y-axis) as a function of input shear rate for the thixotropy loop test. The Casson Model fit is plotted as a solid line and the calculated yield stress and hysteresis area are displayed inset on the plot. Image Credit: Thermo Fisher Scientific – Materials & Structural Analysis
The paint sample displayed shear-thinning behavior again during the thixotropy loop experiment (Figure 3). Minimal difference was observed, however, between the shear rate ramp-up and ramp-down curves which resulted in a comparatively small calculated hysteresis area of ~12 Pa/s.
If a specific paint recovers almost instantly after being exposed to an applied stress or strain, this is indicated by a zero or near-zero hysteresis area. This suggested that it will not sag and droplets will not form after application.
The software, in addition to calculating the hysteresis, also extracted the apparent yield stress of the paint sample. This was done by fitting the measured data with the Casson model. The paint’s calculated yield stress was 35 Pa. It is important to use the yielding behavior of paint in order to assess sagging when paint is applied to a vertical wall 3 or to make predictions regarding shelf-life stability (i.e., analyzing the paint’s ability to resist phase separation during storage).
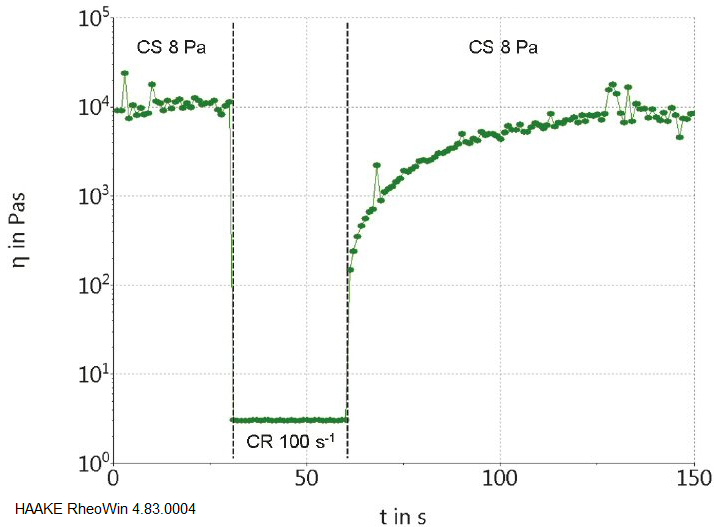
Figure 4. Paint viscosity as a function of time for the three-step shear recovery test: 1) controlled stress (CS) at 8 Pa, 2) controlled rate (CR) at 100 s-1, and 3) CS at 8 Pa. Image Credit: Thermo Fisher Scientific – Materials & Structural Analysis
The application of small stresses in steps 1 and 3 is recommended in order to examine the true and undisturbed recovery behavior of a sample. The simulated effects of gravity acting on paint after being applied is better in shear recovery tests than in any of the above applied shear rate experiments. The paint initially displayed a relatively large and constant viscosity of ~10,000 Pa·s at an applied shear stress of 8 Pa (Figure 4).
Under an applied shear rate of 100 s-1, the viscosity significantly reduced to a constant value of 3 Pa·s. The viscosity of the paint instantly increased to >100 Pa·s when the applied shear was reduced back to a constant stress of 8 Pa, and then continually and more gradually increased over time. The paint had fully recovered to its initial unsheared and resting viscosity at the end of the 90 s recovery period.
The relatively quick and full recovery of the paint has a strong correlation with the results taken from the thixotropy loop experiment. Typically, the leveling behavior of a coating is improved by a delayed recovery, minimizing the risk of unwanted roller or brush marks. It must be noted, however, that the paint tends to sag and form droplets if the recovery is too slow. Therefore, it is essential to strike a balance between too fast and too slow of a recovery as a critical formulation metric in the evaluation of the performance of coatings and paints.
Conclusions
The HAAKE MARS iQ Mechanical-bearing Rheometer is a fully equipped rheometer which offers greater capabilities compared to a standard viscometer. The automatic lift of the measuring head permitted small gap heights (<1 mm) and small sample volumes (<1 mL), as well as accessing high-shear rates (>1000 s-1) without the influence of secondary flows.
The HAAKE MARS iQ Instrument, as a true rheometer, was capable of fully assessing the paint sample and its complex rheological behavior. The paint’s viscosity was measured over four orders of magnitude in shear rate, which therefore allowed the evaluation of the full flow curve of the paint, from the low-shear transport and storage processes to the high-shear application environment.
The thixotropic behavior of the paint was also quantified, enabling a more comprehensive evaluation of the paint’s flow behavior to take place. Additionally, the HAAKE MARS iQ Rheometer’s controlled stress (CS) mode was employed to provide an evaluation of the paint’s real shear recovery. This was performed while the sample was resting to avoid disturbing its microstructure using an applied rotation rate throughout the recovery period.
It has, therefore, been demonstrated that the HAAKE MARS iQ Rheometer is able to assess the complete rheological behavior of coatings and paints required for quality assurance and new product development.
References
- Meyer F., 2014, Application Note V274 - Investigating the thixotropic and shear recovery behavior of paints and coatings using the Thermo Scientific HAAKE Viscotester iQ Rheometer, Thermo Fisher Scientific, 1-5.
- Barnes H. A., 1997, Thixotropy- a review, J. Non- Netonian Fluid Mech., 70, 1-33.
- Schramm G., 2004, A practical Approach to Rheology and Rheometry, 2nd Edition, Thermo Electron Karlsuhe, 143-144.

This information has been sourced, reviewed and adapted from materials provided by Thermo Fisher Scientific – Materials & Structural Analysis.
For more information on this source, please visit Thermo Fisher Scientific – Materials & Structural Analysis.