Food allergies are a growing health issue as they become ever more prevalent around the globe.1
As a reaction to this growth, the European Commission (EC) issued Regulation No. 1169/2011.2 It sets out a checklist of 14 allergenic ingredients that need to be displayed on relevant food labels whenever they are deliberately incorporated into foodstuffs.3
The United States passed the Food Allergen Labeling and Consumer Protection Act (FALCPA) of 2004, an act that outlines eight major allergenic foods, known as the ‘Big-8.’4 Australia and Canada each regulate 12 allergenic foods, while China regulates 11 and Japan seven.5
While the intentional addition of allergenic ingredients into foodstuffs exists to enhance various characteristics, there is also a risk of cross-contamination.
This is a potential risk in food chains where various foodstuffs are processed, and the food sector has not enacted rigorous risk assessment strategies.6
At present, legislation does not tackle the unintentional presence of allergens caused by cross-contamination. To protect the health of consumers, various countries have established their own action levels for several allergens.
For example, the Allergen Bureau of Australia proposed the Voluntary Incidental Trace Allergen Labelling (VITAL) program. This assists the food sector’s allergen risk assessment processes by setting out reference doses for various allergens, including milk, eggs, peanuts, tree nuts and soybeans.7
To protect consumers at risk of allergic reactions to intentional or inadvertent contamination of foodstuffs by allergens, a range of analytical methods for the sensitive detection of allergens in foodstuffs have been developed over time.
These methods can be separated into two main classes:
- Methods that target characteristic proteins of the allergenic ingredient
- Methods that utilize a marker or DNA sequence that indicates the presence of the foodstuff that causes allergy
The first class includes the most generally analytical method, enzyme-linked immunosorbent assays (ELISA). These utilize particular antibodies as part of the detection of species-specific allergen proteins.
While such tests may offer high degrees of sensitivity and specificity, they are very much dependent on the epitopes recognized by the antibodies.
Epitopes can be influenced by cross-reactivity with other species, however. Certain components of the food matrix may hamper the absorption measurements carried out in ELISA tests.
The second class of analytical methods are built on the amplification and detection of specific DNA sequence encoding for the allergenic protein or species-specific DNA marker by PCR.
While DNA is an extremely stable molecule, the cooking, baking or roasting of foods (thermal treatment) can result in the DNA extraction yield being reduced and DNA integrity being compromised.
Highly processed foods, for example, lecithin, gelatin, vegetable oils or starch, contain little to no DNA. This can make them a challenge for PCR testing.
In recent years, mass spectrometry (MS) methods have increasingly been regarded as reliable multi-target approaches for identifying allergens. Mass spectrometry facilitates the identification of allergen contaminants with a high degree of certainty by means of detecting specific and prototype signature peptides.
Several methods have been developed over the decades, taking advantage of liquid chromatography (LC) coupled to various mass analyzers. These employ high-resolution systems for marker peptide discovery and triple quadrupole mass spectrometers for quantification.8
The synchronization and validation of an MS-based method capable of detecting a range of allergens in just one run features among the key goals of recent European projects.9
This article, therefore, outlines the performance of a targeted method utilizing the QSight® 220 liquid chromatography triple quadrupole mass spectrometer (LC-MS/MS).
The article looks at the concurrent quantification of egg and milk allergens present in a thermally processed bakery product, a cookie.
In-house validation results will be outlined, keeping to AOAC method performance requirements for the detection and quantification of food allergens, complying with currently proposed VITAL thresholds.
The Experiment
Standard and Reagents
The method developed was centered on the utilization of native synthetic peptides. As eggs and milk have been extensively investigated as allergens, there is an established consensus as to the review and identification of the most dependable peptide markers.9
The chosen custom marker peptide sequences were synthetized by GenScript and distributed by Twin Helix (Table 1).
Table 1. Optimized MRM and compound-dependent parameters for all peptides, 1milk and 2egg marker peptides, underlined part is used as a common abbreviation, quantifier transitions marked in bold. Source: PerkinElmer Food Safety and Quality
| Protein |
Marker Peptide Sequence |
Precursor [m/z] |
Retention Time [Min] |
Product [m/z] (Fragment) |
CE |
EV |
CCL2 |
| αS1-Casein1 |
FFVAPFPEVFGK |
692.9 (+2) |
13.1 ± 0.02 |
920.3 (y8+)
991.4 (y9+)
1090.4 (y10+) |
-26
-26
-26 |
15
17
25 |
-168
-168
-172 |
| YLGYLEQLLR |
634.6 (+2) |
11.98 ± 0.01 |
658.2 (y5+)
771.3 (y6+)
991.4 (y8+) |
-28
-28
-27 |
31
23
24 |
-124
-152
-140 |
| β-Lactoglobulin1 |
TPEVDDEALEK |
623.3 (+2) |
5.8 ± 0.01 |
572.5 (y102+)
819.1 (y7+)
1047.0 (y9+) |
-30
-29
-30 |
34
41
45 |
-164
-196
-170 |
| VLVLDTDYK |
533.2 (+2) |
8.3 ± 0.01 |
640.8 (y5+)
753.9 (y9+)
853.0 (y7+) |
-24
-22
-22 |
24
18
22 |
-108
-100
-100 |
| Ovalbumin2 |
GGLEPINFQTAADQAR |
844.7 (+2) |
8.9 ± 0.01 |
1007.4 (y9+)
1121.2 (y12+)
1331.6 (y10+) |
-51
-40
-35 |
50
38
29 |
-272
-380
-336 |
| ISQAVHAAHAEINEAGR |
592.1 (+3) |
4.3 ± 0.01 |
545.9 (y5+)
778.5 (y7+)
858.9 (y8+) |
-40
-31
-29 |
20
42
30 |
-200
-128
-204 |
| Vitellogenin-22 |
NIPFAEYPTYK |
671.6 (+2) |
9.1 ± 0.01 |
507.9 (y4+)
557.9 (y9 2+)
1114.9 (y9+) |
-39
-25
-23 |
33
25 25 |
-180
-140
-132 |
| NIGELGVEK |
479.7 (+2) |
6.5 ± 0.01 |
228.0 (b2+)
544.8 (y9+)
673.9 (y9+) |
-18
-24
-21 |
24
27
27 |
-88
-124
-120 |
The supplied lyophilized powder of each peptide was reconstituted with 100 mm Bicarbonate Ammonium:Acetonitrile 80:20 (v/v) to reach the concentration of 1 mg/ml.
As part of the method performance evaluation process, cookie reference materials (RM) for milk allergen detection were obtained from Monitoring and Quality Assurance (MoniQA) in the Total Food Supply Chain Association.10
The kit contained the following samples:
- A negative control gluten-free cookie
- A positive control consisting of dried skim milk powder (SMP) with validated protein content
- Gluten free cookies with SMP at low (3.53 mg/kg) concentration levels
- Gluten free cookies with SMP at high (17.7 mg/kg) concentration levels
A range of other items were purchased for use in the method, including:
- Whole egg powder (purchased from Sigma Aldrich)
- Skim milk powder (Sigma Aldrich)
- MS grade Trypsin Gold (Promega)
- PD-10 disposable desalting cartridges (GE Healthcare Life Sciences)
Sample clean-up was carried out using C18 cartridges (50 mg /1 ml).
Sample Preparation
Both incurred (with skimmed milk powder and whole egg powder) and allergen-free (allergenic ingredients replaced) cookies were made in accordance with an in-house protocol.11 Reference materials in the form of ingredients were incorporated appropriately as part of the baking process.
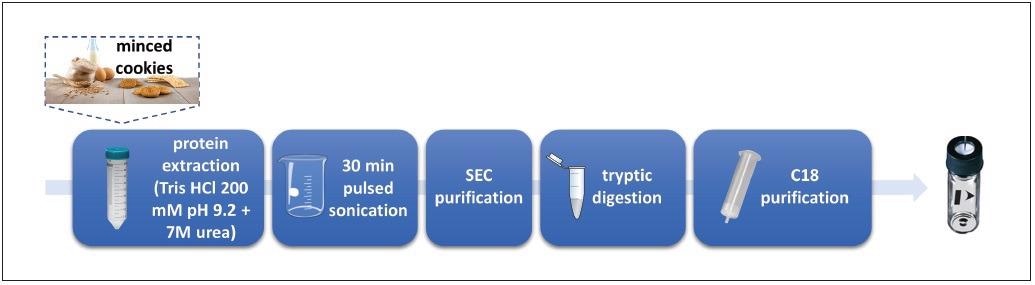
Figure 1. Experimental workflow for the simultaneous detection of milk and egg allergens in cookie samples (adapted from Monaci et al.)12. Image Credit: PerkinElmer Food Safety and Quality
Commercial cookies labeled as “prepared without adding milk and eggs” were supplied by Galbusera SpA and analyzed. A summary of the sample preparation workflow can be seen in Figure 1 and is described below:
- Proteins from minced cookie samples (incurred, allergen free and commercial) were extracted with Tris–HCl buffer 200 mm with Urea 7 M at a pH of 9.2.
- The resulting extract was filtered through a 5 μm acetate cellulose membrane.
- The extracted proteins were subjected to tryptic digestion for 14 hours.
- Digestion was stopped by acidification (HCl 6 M)
- The final digest was centrifuged at 1800 x g for 10 minutes before collecting the supernatant.
- Tryptic digest was subsequently filtered through a 0.45 μm regenerated cellulose (RC) filter.
- A 1 ml aliquot loaded on a C18 SPE column (previously conditioned with methanol and 50 mm of ammonium bicarbonate) was utilized as a further purification step.
- The C18-retained peptides were washed with 800 μl of 0.1% formic acid aqueous solution.
- They were then eluted with 1.5 ml of methanol/water (90/10 v/v).
- The fraction collected was dried under a gentle stream of nitrogen and suspended in 100 μl of 0.1% formic acid in acetonitrile:water (90:10, v/v) solution.
- Samples were finally filtered through a RC 0.45 μm syringe filter.
Hardware and Software
The chromatographic separation was carried out using a PerkinElmer LX50 ultra-high performance liquid chromatography (UHPLC) system.
Detection was done by means of a PerkinElmer QSight 220 LC/MS/MS, which was equipped with APCI and ESI ionization sources. Simplicity™ 3Q software was used for all instrument control and the acquisition and processing of data.
Methods, Performance and Evaluation
A matrix-matched calibration curve was prepared over the concentration range of 0.0125 - 0.25 μg/ml, with four concentration levels, each measured in duplicate. This was done by spiking a defined amount of synthetic peptide stock solutions into a tryptic digest of the allergen-free cookie extract.
The limit of detection (LOD) and the limit of quantifications (LOQ) were each calculated corresponding to the interpolation parameters as 3-times and 10-times, respectively, the standard deviation of the line intercept of the calibration curve divided by its slope.
A highly controversial aspect of food allergens detection has been the correct scale for measuring the contamination level. This can range from allergen labeling as a whole ingredient, to clinical studies and potential threshold levels referring to the overall protein content of the allergen in question.
Prior research was utilized to establish the following conversion factors.
Beginning with synthetic peptide concentrations in μg peptide/ml extract and applying applicable conversion factors stepwise, these were eventually converted into μg total protein/g matrix (Figure 2).
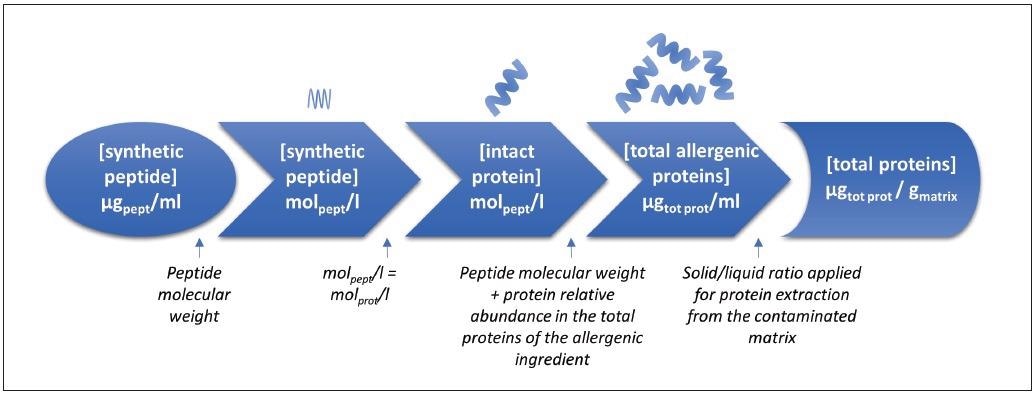
Figure 2. Flowchart calculation for the conversion of egg and milk synthetic peptides concentration (μg peptide/ml extract) into total protein concentration (μg tot prot/g matrix) (adapted from Monaci et al.)12. Image Credit: PerkinElmer Food Safety and Quality
Method analytical features such as sensitivity, recovery and processing effects and repeatability and reproducibility were assessed according to the final reporting unit.
Method precision was evaluated based on five replicates of a 100 μg allergenic ingredient/g matrix contamination level sample for intra-day repeatability. This was repeated over 3 days to gauge inter-day reproducibility. Method recovery was evaluated only for milk by means of the validated reference materials.
The blank sample supplied with the kit was utilized to generate a new matrix-matched calibration curve with the synthetic peptides. The low and high incurred samples were analyzed. The percent ratio between measured and validated concentration values were defined as the method recovery.
The method performance was evaluated according to the AOAC Standard Method Performance Requirements (SMPR) for Detection and Quantitation of Selected Food Allergens.13
Processing Effects
To assess the food processing effects of the marker peptides selected, incurred and incurred materials were prepared.
The incurred materials were derived from their inclusion in blank raw materials before food processing. The spiked material was produced by adding allergenic ingredients to a processed blank food matrix.14
In each case, a final concentration of 300 µg allergenic ingredient/g matrix was targeted. The incurred cookie was a cookie matrix enriched with 3000 µg/g allergenic ingredient, which was diluted 1:10 with an appropriate amount of allergen-free cookie matrix before the dough-making and baking processes.
In contrast, the spiked cookies involved the addition of whole egg powder and the skimmed milk powder onto the blank cookie mince following the baking and grounding steps.
The VITAL Reference Dose
The VITAL system was developed in 2007 and aims to evaluate the impact of allergen cross-contamination in a manner that is quantitative, risk-based and methodological, and to facilitate a decision-making process in regards to the appropriate level of precautionary allergen labeling and management.
VITAL was established after input from consumers, industry and the global scientific risk assessment sector, with the objective of protecting consumers sensitive to allergens.
The probability of having an adverse reaction to an allergen is dependent on two factors: the overall level of allergenic proteins consumed during a meal, and the individual’s level of sensitization to the allergen.
The VITAL system depends on three important values which are used to make calculations:
- The reference amount - the portion size or maximum amount of food eaten in a typical eating occasion
- The reference dose - the total dose expressed in milligrams below which the most allergen-sensitive consumers (between 1 and 5) in an allergic population are likely to suffer an adverse reaction
- The action level - the threshold level of protein concentrations in food guiding the labeling
Action Level 1 means no precautionary labeling is required. Action Level 2 means “may contain” labeling is required. Action Level 3 means “contains” labeling is required.
LC Conditions and MS Parameter Settings
A 10 μl measure of the final extract solution was injected onto a PerkinElmer Brownlee™ Validated Aqueous C18 reverse phase analytical column. The LC conditions employed can be seen in Table 2, and the MS source settings can be found in Table 3.
Table 2. LX50 UHPLC Parameters. Source: PerkinElmer Food Safety and Quality
| . |
. |
| Column |
Brownlee Validated Aqueous C18,
150 X 2.1 mm, 3 μm (Part Number: N9303539) |
| Mobile Phase |
Solvent A: 0.1% formic acid in H2O
Solvent B: 0.1% formic acid in methanol |
| Gradient |
| Step |
Time [min] |
Flow Rate [ml/min] |
%A %B |
| 1 |
0 |
0.2 |
90 |
10 |
| 2 |
17 |
0.2 |
50 |
50 |
| 3 |
17.2 |
0.2 |
10 |
90 |
| 4 |
27 |
0.2 |
10 |
90 |
| 5 |
27.2 |
0.2 |
90 |
10 |
| 6 |
44 |
0.2 |
90 |
10 |
|
| Injection Volume |
10 μL |
| Temperature Oven |
30 °C |
| Autosampler |
10 °C |
Table 3. QSight ESI Source Parameters. Source: PerkinElmer Food Safety and Quality
| . |
. |
| Ionization Mode |
ESI in positive ionization mode |
| Drying Gas |
120 |
| HSID Temperature |
250 °C |
| Nebulizer Gas |
300 |
| Spray Voltage |
+4000 V |
| Source Temperature |
400 °C |
The source parameters - which include temperatures, gas flows and position settings - were optimized for maximum sensitivity utilizing flow injection analysis (FIA) of the prepared synthetic peptide solutions.
The compound-dependent parameters - collision energy (CE), entrance voltage (EV) and collision cell lens 2 voltage (CCL2) - for multiple reaction monitoring (MRM) transitions were optimized in flow injection analysis for all peptides (Table 1).
Results
A sensitive method built on LC separation and MS/MS analysis was established to simultaneously detect the presence of egg and milk allergens in the cookie matrix. Chromatographic conditions for ensuring peptide separation were optimized.
The best balance between peak resolution and the overall running time was studied.
The synthetic peptides were utilized to optimize the method and for every marker peptide that was selected. The three most intense multiple reaction monitoring transitions were selected during the tuning and flow injection analysis stages.
Method Optimization
To validate the lack of interfering peaks from the matrix background, a blank cookie sample was prepared. This was done in accordance with the sample preparation protocol.
The sample was spiked with synthetic peptides at a fixed concentration. A representative chromatogram attained under the optimal conditions of separation is shown in Figure 3. The averaged peak retention times are also shown.
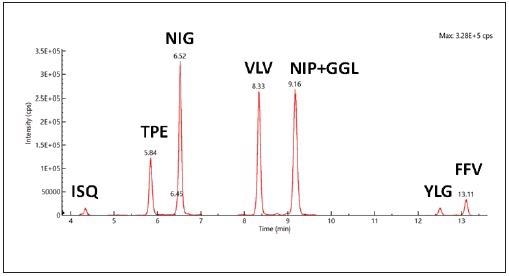
Figure 3. Representative total ion chromatogram (TIC) recorded for synthetic peptides in cookie matrix with a peptide concentration level of 0.166 μg/mL. Image Credit: PerkinElmer Food Safety and Quality
Method Performance Parameters Linearity, LOD and LOQ
The matrix-matched calibration curves in the range of 0.125-0.25 µg/mL demonstrated exceptional linearity with R2>0.999. Utilizing these calibration curves, the LOQ and LOD were determined corresponding to the interpolation parameters as 3-times and 10-times, respectively, the standard deviation of the line intercept divided by the slope.
Thorough evaluation of LOD/LOQ values for the transitions detected facilitated the identification of the best quantifier marker and its most sensitive transition (Table 4).
Utilizing the conversion factors, the values from the matrix-matched calibration curve values in the µg peptide/mL extract were recalculated to the µg total protein/g matrix. Every subsequent performance parameter referred to them.
Robust LODs as low as 0.1 and 3 µg/g were achieved for milk allergens, referred to as αS1-casein (FFV) and β-lactoglobulin (TPE) peptides, respectively.
Egg LODs of 0.3 and 3 µg/g respectively were obtained for the ovalbumin (ISQ) and the vitellogenin – two (NIP) peptides. Typical chromatograms of the quantifiers and qualifiers of the four identified marker peptides, at the lowest calibration point of 0.125 µg/ml, can be seen in Figure 4.
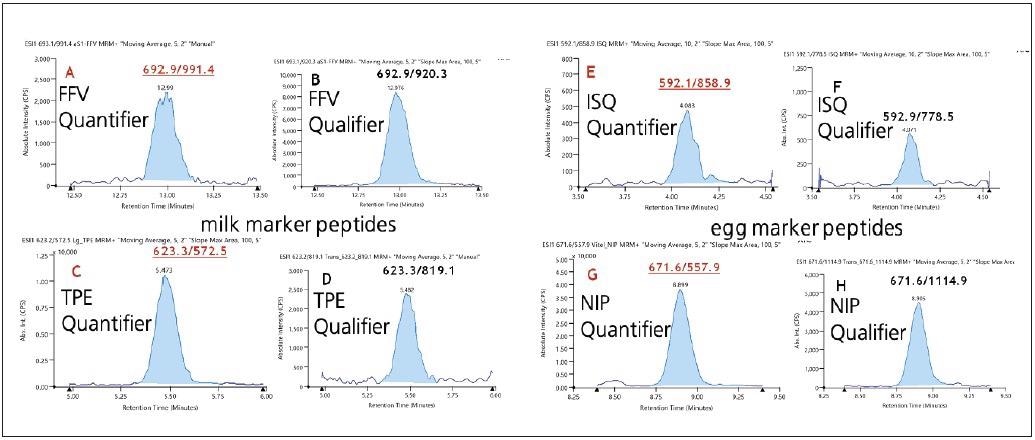
Figure 4. Typical chromatograms acquired for synthetic peptides in cookie matrix: XIC of quantifi er transitions for most sensitive marker peptides of milk (A - FFV; C - TPE) along with their relevant qualifi er transition (B - FFV; D - TPE) and egg, quantifi er transitions (E - ISQ ; G - NIP); qualifi er transitions (F - ISQ; H - NIP), all at a level of 0.0125 μg/mL. Image Credit: PerkinElmer Food Safety and Quality
Method Validation According to VITAL Thresholds
Good sensitivity is required for new analytical methods in order to comply with or overcome the action levels laid out in the VITAL program.
These action levels are regularly revised as new allergological data becomes available from clinical studies. The most recent values from version 3.0 of the VITAL program were revised and subsequently released in October 2019.
Eggs and milk have an equal reference dose of 0.2 mg total protein. The portion size for cookies was estimated at 50 g, giving a result (meeting Action Level 1) of 4 mg total protein/kg.
It is important to note that not only does the sensitivity attained by this method comply with the prescribed values, but it is also capable of detecting even the smallest amounts of allergens (around 13- and 40-fold lower than the action levels1 expected for egg and milk proteins, respectively).
Precision
The inter-day and intra-day accuracy of the analytical method was evaluated to assess the reproducibility and repeatability of the method within the same laboratory (Table 4).
Table 4. Method performance parameters. Source: PerkinElmer Food Safety and Quality
| Allergenic Ingredient: Protein |
Marker |
Transitions |
LOD/LOQ (μg TOT PROT/ g MATRIX) |
R2 |
RSDr%
n=5
Day 1 |
RSDr%
n=5
Day 2 |
RSDr%
n=5
Day 3 |
RSDr% |
| Milk: αS1-Casein |
FFV |
692.9/991.4 |
0.1 / 0.3 |
1.0000 |
2 |
1 |
6 |
4 |
| Milk: β-Lactoglobulin |
TPE |
623.3/572.5 |
3 / 8 |
0.9992 |
8 |
9 |
10 9 |
| Egg: Ovalbumin |
ISQ |
592.1/858.9 |
0.3 / 1 |
1.0000 |
2 |
5 |
2 |
4 |
| Egg: Vitellogenin-2 |
NIP |
671.8/557.9 |
3 / 9 |
1.0000 |
3 |
3 |
4 |
6 |
Intra-day repeatability (RSDr) was determined within five independent replicates and in each case, the values obtained were always lower than 10%. By contrast, the inter-day repeatability (RSDR) was determined over a period of 3 days, analyzing the same fortified samples.
The obtained values were lower than 9% for both for egg and milk quantifier peptides in every instance. A one-way ANOVA test at 95% confidence level was employed to compare the mean values obtained on different days. The results indicated that there was no significant difference for all peptide markers.
Evaluation of Processing Effect
Two types of samples were compared to assess possible food processing effects on the detection of each milk and egg peptide marker:
- A spiked sample, where allergenic ingredients in powdered form were added to blank cookies after the baking and grounding processes
- An incurred sample, where the allergenic ingredients are added before the dough-making and baking processes
The results visibly show that food processing can affect the detection of the selected markers for each of the allergenic ingredients being studied (Figure 5).
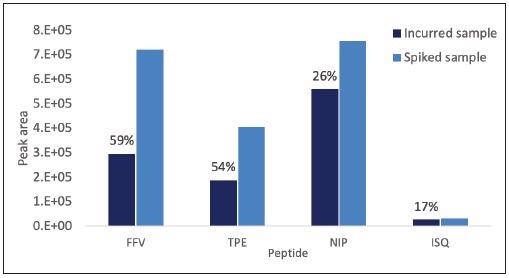
Figure 5. Impact of baking on the detectability of proteotypic peptides of milk and egg allergens calculated by comparing the peak area detected for marker peptides in incurred and spiked cookie contaminated at the level of 300 μg allergenic ingredient/gmatrix. For each peptide/transition the percentage of signal suppression due to b aking is reported. Image Credit: PerkinElmer Food Safety and Quality
A calculation of the processing effect indicated that milk peptides appeared to have the highest susceptibility to baking, with more than a 50% reduction in peak area observed. By contrast, the egg peptides were shown to have resistance, showing a 17% to 26% reduction in peak area.
Trueness
Due to the current lack of availability of reference materials for egg allergens in baked food, the evaluation of trueness was limited to milk allergens.
Each of the incurred samples - low (3.54 µg/g) and high (17.7 µg/g) were analyzed in triplicate. They were also put through the entire sample preparation procedure along with the reference (allergen-free) cookie sample.
By utilizing the percentage ratio between the experimental and theoretical values, an estimate of the method recovery for milk allergen was obtained.
The method recovery calculated with YLG peptide was found to be 57 ± 6%, and 56 ± 7% at the low and high concentration levels, respectively. The recovery that was calculated using the FFV peptide was found to be 57 ± 4% and 50 ± 3% at the low and high concentration levels, respectively.
Compliance with AOAC SMPR 2016.002
The method performance was assessed in accordance with the minimum performance characteristics laid out in the AOAC guideline (SMPR 2016.002) for detecting and quantifying allergens by employing mass spectrometry.
An overview of the results obtained for each of the parameters can be seen in Table 5.
Table 5. Comparison between method performance and the minimum requirements set by AOAC SMP 2016.002 for allergens detection in food. Source: PerkinElmer Food Safety and Quality
| Parameter |
AOAC Method Performance Requirements |
This Method |
| Whole Egg |
Milk |
Whole Egg |
Skim Milk |
| Analytical Range (ppm)* |
10-1000 |
10-1000 |
4-90 |
4-80 |
| MQL (ppm)* |
≤5 |
≤10 |
2 |
0.9 |
| MDL (ppm)* |
≤1.65 |
≤3 |
0.7 |
0.3 |
| Recovery, % |
60-120 |
60-120 |
N.A. |
57±4 |
| RSDr, % |
≤20 |
≤20 |
≤5 |
≤6 |
| RSDR, % |
≤30 |
≤30 |
≤4 |
≤4 |
*Reported as ppm of the target allergen in food commodity, i.e. 25 ppm of “whole egg” in cookies.
To provide a basis for comparison, the LOQs and LODs of the quantitative egg and marker peptides were re-converted into an µg allergenic ingredient/g matrix. The method that was developed met all of the specified requirements. Very challenging LOQs and LODs were attained for both egg and milk allergens in the cookie matrix.
Sample Measurement
The method was applied to samples obtained from various lots of commercially available cookies labeled as “prepared without adding of milk and eggs.” This was carried out to assess the genuine absence of any evidence of egg and milk allergens, according to the method’s sensitivity.
The quantifiable peak area for egg and milk quantifier peptides was not detected. This suggests that there was no detectable accidental contamination of these samples within the sensitivity limits of the developed method.
Conclusion
This article outlines the optimization of an LC-MS/MS method utilizing the PerkinElmer QSight 220 to detect egg and milk allergens in cookies, which were selected as a representative complex food matrix.
Extremely challenging values for the LOD and LOQ were found for milk and egg allergens, facilitating the detection of contamination levels at a point lower than the (action level 1) reference threshold laid out for milk and egg in the VITAL program (Version 3.0).
The in-house validation procedure carried out supplied analytical features in compliance with the minimum requirements as set out in the AOAC SMPR 2016.002 guidelines for the detection of allergens in food.
The QSight 220 LC/MS/MS meets the required sensitivity and selectivity necessary for the successful detection and quantification of allergens.
Additional information on this report can be obtained from the corresponding published peer-reviewed paper.12
References
- Prescott, S.; Allen, K. J. Food Allergy: Riding the Second Wave of the Allergy Epidemic. Pediatric Allergy and Immunology 2011, 22 (2), 155–160. https://doi.org/10.1111/j.1399-3038.2011.01145.x.
- European Commission (EU). Regulation of the European Parliament and of the Council of 25 October 2011 on the Provision of Food Information to Consumers. Official Journal of the European Union 2011, 1169, L 304/18.
- European Commission (EU). Commision Directive 2007/68/EC. Official Journal of the European Union 2007, OJ 310 (13), 1–4.
- Nutrition, C. for F. S. and A. Food Allergen Labeling and Consumer Protection Act of 2004 (FALCPA). https://www.fda. gov/food/food-allergensgluten-free-guidance-documents-regulatory-information/food-allergen-labeling-and-consumer-protection-act-2004-falcpa (accessed Aug 13, 2020).
- Food Allergens - International Regulatory Chart | FARRP https:// farrp.unl.edu/IRChart (accessed Aug 13, 2020).
- Hattersley, S.; Ward, R.; Baka, A.; Crevel, R. W. R. Advances in the Risk Management of Unintended Presence of Allergenic Foods in Manufactured Food Products - An Overview. Food and Chemical Toxicology 2014, 67, 255–261. https://doi. org/10.1016/j.fct.2014.01.036.
- VITAL ® Voluntary Incidental Trace Allergen Labelling| Allergen Bureau http://allergenbureau.net/vital/ (accessed Aug 13, 2020).
- Monaci, L.; De Angelis, E.; Montemurro, N.; Pilolli, R. Comprehensive Overview and Recent Advances in Proteomics MS Based Methods for Food Allergens Analysis. TrAC - Trends in Analytical Chemistry 2018, 106, 21–36. https://doi. org/10.1016/j.trac.2018.06.016.
- Pilolli, R.; Nitride, C.; Gillard, N.; Huet, A. C.; van Poucke, C.; de Loose, M.; Tranquet, O.; Larré, C.; Adel-Patient, K.; Bernard, H.; Mills, E. N. C.; Monaci, L. Critical Review on Proteotypic Peptide Marker Tracing for Six Allergenic Ingredients in Incurred Foods by Mass Spectrometry. Food Research International 2020, 128, 108747. https://doi.org/10.1016/j.foodres.2019.108747.
- MoniQA Association - Reference Materials for Food Allergen and Gluten Free Analysis https://www.moniqa.org/reference_materials_food_allergen_gluten_free_analysis (accessed Aug 13, 2020).
- Pilolli, R.; De Angelis, E.; Monaci, L. Streamlining the Analytical Workflow for Multiplex MS/MS Allergen Detection in Processed Foods. Food Chemistry 2017, 221, 1747–1753. https://doi. org/10.1016/j.foodchem.2016.10.110.
- Monaci, L.; De Angelis, E.; Guagnano, R.; Ganci, A. P.; Garaguso, I.; Fiocchi, A.; Pilolli, R. Validation of a MS Based Proteomics Method for Milk and Egg Quantification in Cookiesat the Lowest VITAL Levels: An Alternative to the Use of Precautionary Labeling. Foods 2020, 9 (10), 1489. https://doi.org/10.3390/foods9101489.
- AOAC. Standard Method Performance Requirements for Detection and Quantitation of Selected Food Allergens, 2016.002. 2016.
- Mattarozzi, M.; Careri, M. The Role of Incurred Materials in Method Development and Validation to Account for Food Processing Effects in Food Allergen Analysis. Anal Bioanal Chem 2019, 411 (19), 4465– 4480. https://doi.org/10.1007/s00216-019-01642-3.
Acknowledgments
Produced from materials originally authored by Elisabetta De Angelis Rocco Guagnano, Rosa Pilolli, and Linda Monaci from CNR-ISPA, Institute of Sciences of Food Production; and Aristide Ganci and Ignazio Garaguso from PerkinElmer Inc.

This information has been sourced, reviewed and adapted from materials provided by PerkinElmer Food Safety and Quality.
For more information on this source, please visit PerkinElmer Food Safety and Quality.