Beginning in the second half of 2008, the sad consequences of adding melamine to milk to artificially increase the apparent protein content have highlighted the requirement for screening techniques for the early detection of such adulteration of milk.
A number of analytical techniques for establishing melamine in milk and milk products down to a few ppm or even ppb exist (such as ELISA & GCMS), but these techniques add high cost and time if they are to be utilized on a routine basis.
Achieving single digit ppm melamine detection limits with infrared analysis is impractical, but screening for melamine adulteration can be effectively performed by utilizing the Lactoscope FTIR simultaneously as payment or incoming control tests are being performed, eliminating additional analytical costs and testing time.
The apparent protein content increases by approximately four times the amount of melamine added with the addition of melamine to milk when the protein content is determined by either N-Kjeldahl or standard techniques of infrared analysis.
The apparent protein content of milk can only be raised about 35 % given the limited solubility of melamine in water (3 g/kg or 3000 ppm) at ambient temperature, or 12 g/l. The close resemblance of infrared spectra of solutions of protein only (in red) and of protein plus 2g/l of added melamine (in black) are shown in Figure 1a.
The main infrared signal of protein differs between the two spectra and is centered near 1545 cm-1, but the overall absorption patterns appear similar. Spectra of adulterated milk are more of a challenge to distinguish from those of regular milk due to the natural variability in milk composition of both major and minor components. A spectrum of raw milk is shown in figure 1b.
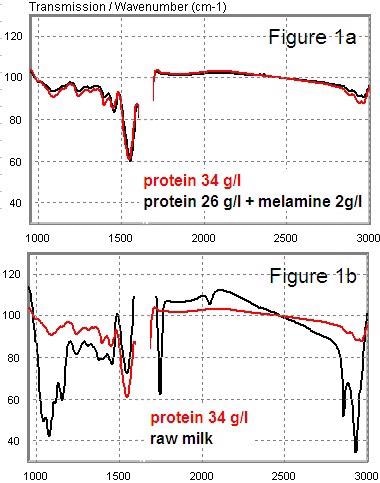
Figure 1. Image Credit: PerkinElmer Food Safety and Quality
A screening method based on pattern recognition would be insensitive given these rather small spectral differences unless specific knowledge of the contaminant’s spectra is available.
Two absorptions are seen in the spectrum of melamine dissolved in water in Figure 2. The one centered near 1460 cm-1 coincides with the most prominent absorption of urea in milk; the other centered at 1560 cm-1, overlaps the main absorption of protein.
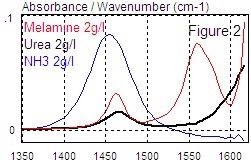
Figure 2. Image Credit: PerkinElmer Food Safety and Quality
A method known as NPN/calculated urea (NPN/CU) was developed by Delta Instruments BV for the Lactoscope FTIR based on a close resemblance in spectral response and the high correlation between NPN and urea of regular cow milk.
Using this technique, the urea content of regular milk is quantified from the NPN content as established by the Lactoscope FTIR. An estimate of the melamine content of adulterated milk can be calculated utilizing the same method; this will be referred to as NPN/calculated melamine (NPN/CM).
As urea and other NPN components, such as ammonia (see figure 2), also contribute, the specificity of this method is somewhat restricted. Yet, since it can be employed as an early alert for the adulteration of milk with ammonia, which can be denoted with NPN/calculated ammonia (NPN/CA), this method may serve a wider purpose.
A full spectrum model was also developed as an alternative to the NPN/CM method as it was recognized that greater specificity for melamine might be required. This article outlines the applicability of both methods and supplies details on the performance achieved with the melamine specific model.
Studies by PerkinElmer demonstrated that the NPN/CM approach enables the discrimination of melamine added to milk down to a level of 500 ppm. The detection level is further reduced to 100 ppm with the melamine specific model.
Materials and Methods
Milk Samples Spiked with Melamine
To span a maximum natural variation in fat, protein and lactose content, two crates (A & B) of 48 milk samples per crate, all sample remains of milk payment testing at the main milk control station in the Netherlands (“Qlip”) were chosen (early Oct-2008).
Shortly before analysis, analytical grade melamine (Fluka) was dissolved into a concentration of 20 - 30 g/l in demineralized water at around 80 °C and added on a mass per mass basis to the milk samples, which were preheated to 40°C.
Melamine was added at 8 levels to samples of crate A; 6 samples per level; levels of approx. 0, 300, 400, 500, 750, 1500, 3000 & 6000 ppm melamine. Melamine was added at 7 levels to samples of crate B + one extra (N=49), at levels of approx. 0, 200, 400, 600, 1000, 1400 & 1900 ppm melamine.
To the samples of crate B, extra urea was added at 7 levels in an orthogonal fashion to the melamine added; urea levels of approx. 0, 150, 300, 500, 800, 1100 & 1500 ppm urea.
FPL Milk Calibration Sets
Two standard milk calibration sets (FPL sets) were gathered from Qlip, each made up of a concentration series of fat (F0..F8, 0 to 8 %m/m), protein (P1..P5, 1.5 to 5 %m/m) and lactose (L1..L5, 3 to 5.5 %m/m) of two productions (May and July) were analyzed on the Lactoscope FTIR without melamine added.
The second set was analyzed twice by utilizing a normal and a subnormal performing homogenizer (L0547 & L0791 resp.).
Milk Dataset for Evaluation
A large dataset (N>17000) of (mainly) milk spectra gathered during production at a major cheese plant in the Netherlands over a continuous period of over a year (from Jan-2006 till May-2007) was utilized for evaluation purposes.
Samples (approx. 1%) were omitted from the set for which either:
1) The measurement had been interrupted
2) Duplicates were found to poorly reproduce
3) Protein (<0.5 %m/m), fat (cream & double cream) or lactose (<3 %, >6 %) contents differed significantly from milk
Calculation of NPN/CU, NPN/CM and NPN/CA
The Lactoscope FTIR calculated results for NPN/calculated urea (NPN/CU) in ppm (mg/kg) automatically from predictions for the Non Protein Nitrogen contents (NPN) of the samples. In formula:
| Calculated urea = 1/a * (NPN - b) |
[1] |
Where a, and b are constants, derived from the study in 2004 after the prediction of urea on the basis of the NPN contents of milk.
Results for NPN/calculated melamine (NPN/CM) in ppm were calculated from the NPN/CU results by utilizing the formula:
| Calculated melamine = 1/fcm * (NPN/CU - 200) |
[2] |
Where the value of 200 ppm subtracted from the NPN/CU result represents an estimate of the median urea content of the milk samples.
fcm is the response factor of melamine, with the given model for NPN/CU on the Lactoscope FTIR, as determined from standard addition of melamine to milk (see results & discussion, figure 3 a,b).
Results for NPN/calculated ammonia (NPN/CA) in ppm ammonia (mg NH3/kg) were calculated in a similar way by utilizing the formula:
| Calculated ammonia = 1/fca * (NPN/CU - 200) |
[3] |
Where fca, the response factor of ammonia, with the given model for NPN/CU on the Lactoscope, is established from standard addition of ammonium chloride to milk (in mg NH3/kg milk, as seen in Figures 7 a and b. the median urea content of the milk samples of crate A is represented by the value of 200, as above.
Melamine Model Development and Statistics
Grams/PLSIQ software was used to develop a full spectrum IR-model for the detection of melamine with high specificity. The calibration set was made up of the samples of crate B and the FPL sets.
A single replicate per analysis (performed in duplicate or more) was included.
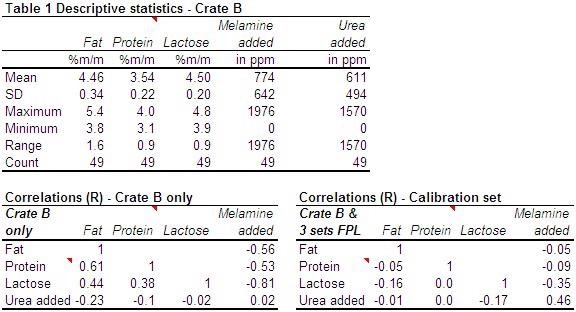
Melamine added to crate B was varied orthogonal to the extra urea added. Table 1 shows the descriptive statistics of crate B and correlations among the constituents of both crate B alone and the calibration set.
Table 2. Source: PerkinElmer Food Safety and Quality
The optimum number of factors was established via cross validation (cyclic, leaving out one sample at a time), yielding a standard error of cross validation (SECV).
First, the model was validated on the basis of results for melamine added to crate A, for which a standard error of prediction (SEP) was calculated and corrected for a slight deviation (±1 %) in slope (denoted with SEP*), which was attributed to an analytical error in the sample preparation.
Further validation was performed on the reanalysis of production datasets of milk. A dataset including sour milk samples was among these, and it was determined that there was a modest error in predicted values for melamine as a function of pH.
A pH correction was calculated based on that data, and it was applied to all melamine results reported here and is referred to as “Melamine (pH corrected).”
Final validation of the pH corrected model was based on the production milk dataset of over 17000 samples gathered on another Lactoscope FTIR at a major cheese plant. The mean and standard deviation (SD) in the melamine responses were quantified over this dataset as a whole.
Results and Discussion
The NPN/CM Approach
The urea content of milk is calculated from the IR determination of the Non Protein Nitrogen content (NPN) by a slope/intercept calculation according to formula [1] above and known as “ NPN/CU” in both the Combi and FTA Lactoscope FTIR versions.
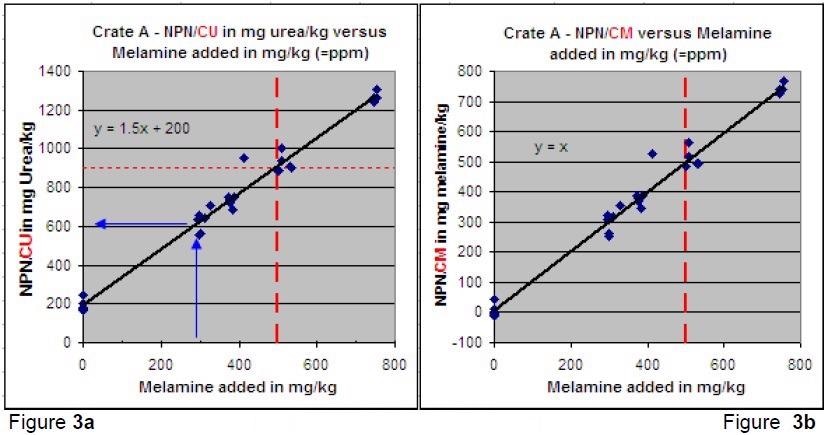
Figure 3. NPN/CU & NPN/CM. Image Credit: PerkinElmer Food Safety and Quality
This model has been shown to predict the urea content of regular cow milk with good accuracy. Thanks to the wide range of milk samples utilized in the calibration, consisting of both individual and herd cow milk samples gathered from all over the Netherlands, the NPN/CU model is considered robust and rugged.
The good accuracy achieved with this method is mainly down to the close correlation between urea and NPN in milk.
Any model for NPN or urea in milk developed on the basis of regular cow milk is expected to show a strong response to added melamine given the strong overlap of the most prominent absorption of urea in water and one of the absorptions of melamine, centered at 1460cm-1 (figure 2).
For melamine added to samples of crate A, this was also observed. NPN/CU results are displayed in Figure 3a as a function of melamine added in ppm (= mg/kg).
Without melamine added, NPN/CU averages approx. 200 ppm (or 200 mg urea/kg milk), a regular level of urea in milk, and about the median urea content of samples of crate A in this instance.
NPN/CU readings rise to on average 650 ppm upon the addition of 300 ppm melamine. Response increases to 900 ppm with 500 ppm added to the NPN/CU.
With regular herd milk, values of 800 ppm urea and higher are not observed very often, so a discrimination limit for samples considered “suspicious or not” can be set to a level of 500 ppm or 0.05 %m/m melamine added to milk when using the NPN/CM method.
Based on the slope (“fcm”) of 1.5 in the response for melamine on the NPN/CU scale and the median content of 200 ppm urea, results have been rescaled according to formula [2] into results for what is termed as NPN/calculated melamine (NPN/CM) in Figure 3b.
Deviations from the line y=x in this plot largely reflect the natural variation in the urea content of the samples.
The Full Spectrum Melamine Approach
A full spectrum model has been developed to detect melamine in milk with better specificity as an alternative to the NPN/CM method.
The calibration set applied consisted of milk samples of crate B with melamine and urea added in an orthogonal fashion and three milk calibration sets, known as FPL sets (see Materials and Methods).
Figure 4a shows the results of the cross validation for samples of crate B. Characterized by a standard error of 17 ppm (SECV, computed over the complete set), a linear relationship is observed. All points fall close on the y=x line, irrespective of the amount of urea (0 to 1500 ppm) added to the samples, as shown in Figure 4a.
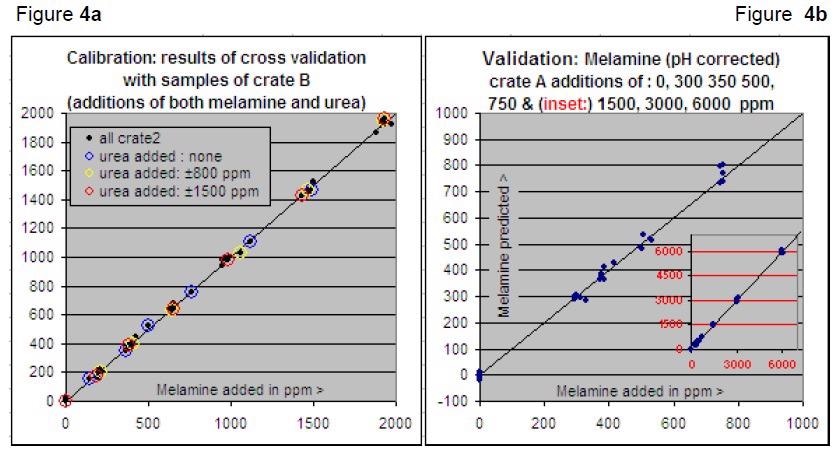
Figure 4. Melamine specific model. Image Credit: PerkinElmer Food Safety and Quality
So the melamine response is free of interference from urea when using this full spectrum model. The same was found to hold with regard to interference from ammonia added to milk up to 500 ppm NH3 in the form of NH4Cl.
On the other hand, the souring of milk was discovered to adversely affect the melamine readings but could be easily corrected by incorporation of a pH correction. All data on the melamine specific model reported were corrected and results are referred to as “melamine (pH corrected)”.
Residuals for the calibration set samples shown in Figure 5 reinforce the independence in melamine response as a function of urea content as well as fat, protein and lactose contents over the ranges 0 to 8 % fat (F0..F8), 1.5 to 5 %protein (P1..P5) and 3 to 6 % lactose (L1..L5).
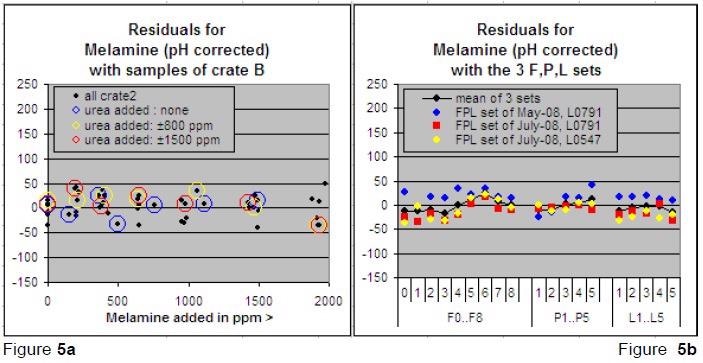
Figure 5. Melamine calibration residuals. Image Credit: PerkinElmer Food Safety and Quality
The validation on the basis of samples of crate A, of which a graph is given in figure 4b, showed the good linearity and accuracy in response over the range of up to 6000 ppm melamine.
Table 2 shows a summary of the statistics for the melamine specific model. Standard errors of 21 ppm both for the standard error of calibration (SEC) and standard error of prediction (SEP) for samples of crate A (N=36, up to 1500 ppm were calculated, i.e., exclusive the 2*6 samples with additions as high as 3000 and 6000ppm).
Table 2. Source: PerkinElmer Food Safety and Quality
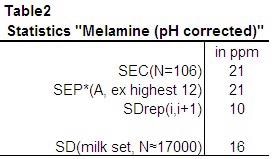
The repeatability standard deviation (SDrep(i,i+1)) determined from consecutive measurements of samples analyzed in duplicate or triplicate was usually 10 ppm.
Further validation on the basis of a milk set collected over a period of more than a year of over 17000 analyses gathered from a large cheese plant in the Netherlands showed a mean response for melamine of 10 ppm and a value of 16 ppm for the standard deviation in the results.
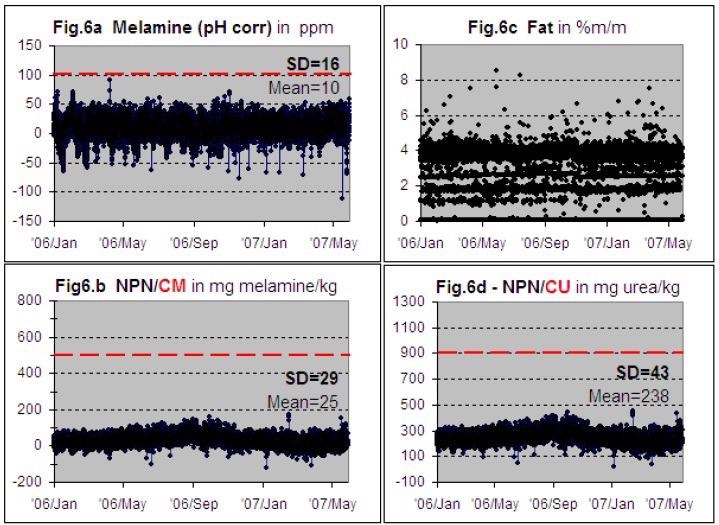
Figure 6. Milk set from practice (N≈17000). Image Credit: PerkinElmer Food Safety and Quality
Figure 6a shows a graph of the results for Melamine (pH corrected). Although most samples analyzed were just milk samples, the set was discovered to include some more samples and the variability in milk samples analyzed was quite big.
This is shown in Figure 6c by the graph of the fat results. It demonstrates that the fat content of a majority of samples was around 4 %m/m or at another discrete level, e.g., close to 2 % or 0 % fat, but the range in fat runs from 0 up to 8 %. Some samples more extreme in composition were eliminated (see Material and Methods).
The majority of results for Melamine (pH corrected) fall in a narrow range of around 0 ppm of ±50 ppm. A few outlying points are observed in negative direction, but these are still negligible in number. The highest result appears 91 ppm, shortly before (a day) preceded by a sample for which the response is 73 ppm.
However, both results were found to include samples of whey, of which some 20 more samples were present in the set and for which the average melamine response was discovered to be 46 ppm, with a standard deviation of 19 ppm in the results.
It can be concluded that adaptation to a matrix like whey can be made by a simple bias correction of around 50 ppm. This brings us to the conclusion that the discrimination limit can be safely set for milk at 100 ppm regarding “suspected or not” for Melamine (pHcorr).
The results for the uncontaminated milk set of Figure 6b demonstrate why the NPN/CU limit cannot be as low as the full spectrum model. Selecting a limit of 500 ppm is certainly safe and might even be lowered somewhat if the variation in NPN/CU content seen in Figure 6d stays in a 100 to 400 ppm urea band with some seasonal dependence.
The NPN/CA Method
Lastly, what has been baptized NPN/calculated ammonia (NPN/CA) deserves some attention. Figure 7a shows the increase in NPN/CU response in milk as a function of ammonia (NH3) added in the form of ammonium chloride (NH4Cl, i.e., in such a form that the pH of the milk sample stays neutral).
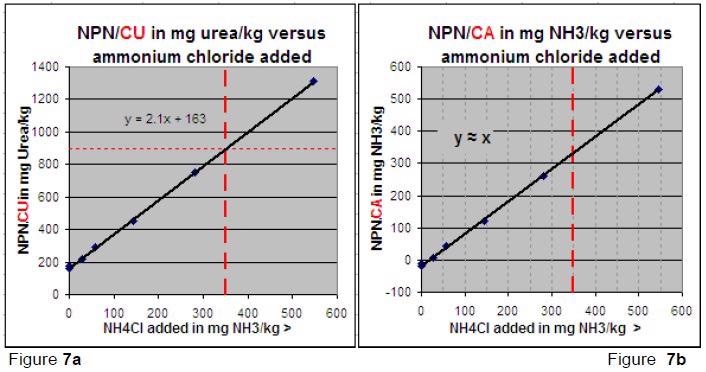
Figure 7. NPN/CU & NPN/CA. Image Credit: PerkinElmer Food Safety and Quality
The results fall on a straight line because ammonium chloride was added in different amounts to a single sample of fresh milk. The slope of the line (fca) amounts 2.1, expressed in ppm urea versus ppm ammonia.
Rescaling according to equation [3] of Material & Methods yields the values expressed in NPN/CA shown in Figure 7b. In this case, following the same line of reasoning which was utilized in the instance of NPN/CM, the discrimination limit for “adulterated or not” by the addition of ammonia can be set to 350 ppm.
Neither added urea nor added ammonia would lead to higher protein readings when using standard infrared analysis techniques, whereas N-Kjeldahl would demonstrate elevated protein results when ammonia has been added to milk.
Yet, the NPN/CA method could be of value in detecting this form of adulteration if ammonia (in the form of NH4OH) is added to restore the pH of sour milk to mask its poor quality.
Conclusion
The present work shows the practicality of screening raw milk for the presence of melamine down to a level of 500 ppm or 0.05 %m/m by utilizing the NPN/CM approach on a Lactoscope FTIR.
The discrimination limit can be reduced further to 100 ppm (0.01 %m/m) by utilizing the melamine specific detection model.
Added melamine will only become detectable when added in sufficient quantities to raise the apparent protein content (normally about 3 %) by 0.2 %m/m or 0.04 %m/m respectively, given the infrared multiplying factor of between 3 and 4 for melamine (in %m/m) on IR based protein (in %m/m) results.

This information has been sourced, reviewed and adapted from materials provided by PerkinElmer Food Safety and Quality.
For more information on this source, please visit PerkinElmer Food Safety and Quality.