Water-soluble vitamins (WSV), primarily made up of the vitamin B complex, are key ingredients in many foods, especially in infant formulas. These vitamins have a key role in metabolic pathways and, therefore, relay considerable health benefits when introduced into our daily diet.
As there are daily nutritional recommendations for humans related to these vitamins as established by independent testing labs, the Food and Drug Administration (FDA) and food and supplement manufacturers, the ability to quantitatively verify the vitamin content in such products is crucial.
This can be particularly challenging when evaluating fortified foods due to the variable range in vitamin concentration while maintaining daily allowances (see Table 1).
Table 1. Daily required value (DV) for each of the analyzed vitamins. Source: PerkinElmer Food Safety and Quality
| Vitamin |
DV (daily required value; mg; per FDA guideline1) |
| B3 (niacin) |
20 |
| B6 |
2 |
| B3* (niacinamide) |
Not available |
| B1 |
1.5 |
| B9 |
0.4 |
| B7 |
0.3 |
| B12 |
0.006 |
| B2 |
1.7 |
For example, in infant milk, vitamin B12 (cyanocobalamin) is present at 1-2 ppb while vitamin B2 (riboflavin) is present at 1000-times higher concentration (1-2 ppm). Therefore, any quantitative analytical procedure must have the capacity to accommodate this great variance in concentration.
Here, an LC-MS/MS method is presented for the quantitative analysis of B-vitamins in a single run. The vitamins analyzed included vitamin B1 (thiamine), B2 (riboflavin), B3 (niacin), B3* (niacinamide), B6 (pyridoxine), B7 (biotin), B9 (folic acid) and vitamin B12 (cyanocobalamin), utilizing three internal standards.
A basic liquid extraction was employed for the extraction of vitamins from infant formula. The sample extraction paired with the rapid analytical method (<6 mins) was deemed reliable, robust and the least time-consuming.
Experimental
Hardware/Software
A PerkinElmer Altus™ UPLC® System incorporating the Altus A-30 Solvent/Sample Module, integrated vacuum degasser and column heater was used for the chromatographic separations. For detection, a PerkinElmer QSight™ 210 MS/MS detector was used. Instrument management, analysis and data processing were conducted using the Simplicity 3Q™ software platform.
Method Parameters
The LC and MS/MS method parameters are displayed in Tables 2 and 3, respectively.
Table 2. LC Method Parameters. Source: PerkinElmer Food Safety and Quality
| . |
. |
| Column |
PerkinElmer Altus UPLC® BEH C18, 1.7 µm, 2.1 x 50-mm (Part# N2972000) |
| Mobile Phase |
Solvent A: 5 mM ammonium formate, pH to 4.9 with formic acid
Solvent B: Acetonitrile (ACN)
| |
Time (min) |
Flow rate (mL/min) |
%A |
%B |
Curve |
| 1 |
Initial |
0.5 |
100.0 |
0.0 |
| 2 |
1.60 |
0.5 |
100.0 |
0.0 |
6 |
| 3 |
4.50 |
0.5 |
70.0 |
30.0 |
6 |
| 4 |
5.00 |
0.5 |
50.0 |
50.0 |
6 |
| 5 |
6.00 |
0.5 |
50.0 |
50.0 |
6 |
| 6 |
6.05 |
0.5 |
100.0 |
0.0 |
6 |
|
| Analysis Time |
6 min; re-equilibration time: 4 min |
| Pressure |
6900 psi/460 bar (maximum) |
| Oven Temp. |
40 ºC |
| Injection Volume |
3 µL |
Table 3. MS/MS Parameters. Source: PerkinElmer Food Safety and Quality
| . |
. |
. |
. |
. |
. |
| Ionization Mode: |
ESI - positive |
|
|
|
|
|
| Drying Gas (Nitrogen) |
75 |
HSID Temp |
320 °C; |
Electrospray V1 |
5000 V |
Exper. Group 1
(0.20 – 0.85 min) |
MRM Transitions (amu) |
Quantifier
Ion |
Qualifier
Ion |
EV |
CE(V) |
Dwell Time
(msec) |
| B3 (niacin) |
124.3/80.2 |
124.3/53.2 |
55 |
-30 |
100 |
Exper. Group 2
(0.7 – 2.5 min) |
MRM Transitions (amu) |
Quantifier
Ion |
Qualifier
Ion |
EV |
CE(V) |
Dwell Time
(msec) |
| B1 (thiamine) |
265.0/121.7 |
265.0/144.0 |
20 |
-25 |
50 |
| B1’ (thiamine; 13C4C8H17N4OS+) |
269.0/122.0 |
|
20 |
-25 |
50 |
| B3* (niacinamide) |
123.3/80.2 |
123.3/53.2 |
25 |
-30 |
50 |
| B6 (pyridoxine) |
170.3/133.7 |
170.3/105.8 |
22 |
-28 |
50 |
Exper. Group 3
(3.0 – 4.4 min) |
MRM Transitions (amu) |
Quantifier
Ion |
Qualifier
Ion |
EV |
CE(V) |
Dwell Time
(msec) |
| B7 (biotin) |
245.0/96.4 |
245.0/104.5 |
24 |
-45 |
35 |
| B7’ (biotin; C10D2H14N2O3S) |
247.0/98.7 |
|
24 |
-45 |
35 |
| B9 (folic acid) |
442.1/295.2 |
442.1/176.0 |
21 |
-22 |
35 |
| B12 (cyanocobalamin): |
678.9/147.2 |
678.9/399.2 |
23 |
-45 |
35 |
| B2 (riboflavin) |
377.0/172.3 |
377.0/198.2 |
35 |
-48 |
35 |
| B2’ (riboflavin; 13C4C13H2015N2N2O6) |
383.0/175.4 |
|
35 |
-48 |
35 |
EV = Entrance voltage; CE(V) = Collision energy
Solvents, Standards and Sample Preparation
HPLC-grade solvents, reagents and diluents were used and filtered via 0.22-µm nylon filters. For all dilutions, 5-mM ammonium formate, modified to pH 4.9 with 10% formic acid, was used.
All B-vitamin standards, including B1 (thiamine), B2 (riboflavin), B3 (niacin), B3* (niacinamide), B6 (pyridoxine), B7 (biotin), B9 (folic acid) and B12 (cyanocobalamin) were acquired from Sigma-Aldrich® Inc., Saint-Louis, MO.
Three internal standards were used for calibration and quantitation purposes: vitamins B1’ (thiamine; 13C4C8H17N4OS+), B7’ (biotin; C10D2H14N2O3S) and B2’ (riboflavin; 13C4C13H2015N2N2O6), were all acquired from Sigma-Aldrich® Inc.
B1’ was utilized for the calibration of B3, B3*, B6 and B1, while B2’ was used for B2. B7’ was used for B7, B9 and B12. The samples analyzed included two commercially available infant formula powders, labeled IF1 and IF2.
To protect against possible standard or sample instability, all stock and working standards were preserved in refrigeration units until used; all prepared samples were assessed within four hours, and only amber 2-mL LC vials were used. All calibrants and samples were filtered using 0.22-µm nylon filters.
Experimental
Standard Preparation
Preparation of a 40-µg/mL stock standard of B2, B9 and B7 was completed in a 250-mL volumetric flask. As the three vitamins dissolve best under basic conditions, 50 mL of 0.05% ammonium hydroxide (NH4OH) was introduced to the flask, which was then shaken until the standards were completely dissolved.
Dilutent was then poured to fill the flask to the specified mark. Preparation of a 40-µg/mL stock standard of B3, B3*, B6 and B1 and a 5-µg/mL stock standard of B12 was performed using a straight diluent.
25 mL of each of the three stock solutions plus 25 mL of diluent were added to a 100-mL volumetric flask for the working standard. Following the shaking process, the flask was then placed into a refrigerator for storage.
This working standard also functioned as the level-6 calibrant, including 10 µg/mL of each vitamin, except B12, which was at 1.50 µg/mL.
Internal standard stock solutions (ISTDs) were prepared with the addition of the complete contents of each isotopic vitamin standard, as follows: 2 mg of B1’, 5 mg of B7’ and 1 mg of B2’ were passed to a 20-mL, 250-mL and 10-mL volumetric flask, respectively.
To support dissolution, the B1’ and B2’ standards were originally transferred to each flask through 5x rinses of 1 mL 0.05% NH4OH. Diluent was poured into three flasks which were filled to mark. The consequent stock concentrations were 100 µg/mL for B1’ and B2’ and 20 µg/mL for B7’.
Six calibration levels were developed by serially diluting the working standard. The resulting vitamin concentrations are shown in Table 4.
Table 4. Vitamin B concentrations at each calibration level. Source: PerkinElmer Food Safety and Quality
| Calibration Level |
Conc. of B1, B3, B3*,
B6, B7, B9 and B2 (µg/mL) |
Conc. of B12
(µg/mL) |
| 1 |
0.004 |
0.0005 |
| 2 |
0.02 |
0.0025 |
| 3 |
0.10 |
0.0125 |
| 4 |
0.40 |
0.050 |
| 5 |
2.00 |
0.250 |
| 6 |
10.00** |
1.250 |
** Level 6 was not used for B1, B3, B6 and B9.
Vitamin B12 was calibrated utilizing a much lower concentration range due to its possessing a considerably lower DV guideline (0.006 mg). Prior to running each batch, 50 mL of each calibrant level was poured to a 50-mL volumetric flask and then spiked to 0.1 µg/mL with internal standards through the addition of 50 µL of ISTDs B1’ and B2’ and 250 µL of ISTD B7’.
Note: If less than 50 mL of any calibrant level is accessible, the ISTDs should be proportionately added to the available volume. All calibrants were injected in triplicate.
Sample Preparation
The preparation of the two infant formula powders (labeled IF1and IF2) was completed by first weighing out the necessary amount of each powder into a tared 50-mL centrifuge tube and then adding 20 mL of diluent. The amount required was established using the recommended proportion of powder-to-water published on the label claim for each product.
For 15 minutes, each centrifuge tube was pulse-vortexed whereupon the solutions were spiked to 0.2 µg/mL with internal standards by introducing 40 µL of ISTDs B1’ and B2’ and 200 µL of ISTD B7’.
To compensate for the 2-fold dilution during the following sample preparation procedure the samples were spiked to 0.2 µg/mL ISTD. 20 mL of acetonitrile, acidified with 10 µL of 10% formic acid, was then introduced into each tube.
Subsequent to this process, five minutes of pulse vortexing and centrifugation were conducted at 7800 rpm for 10 minutes.
The acidified ACN caused a protein crash/precipitation, which allows the user to eliminate the fatty/solid material via centrifugation. 10.0 mL of the supernatant was then transferred carefully from each of the three tubes to individual 50-mL centrifuge tubes and dried down to ~1 mL.
Each tube was filled with diluent to the 10-mL mark, then pulse-vortexed for three minutes, and finally centrifuged at 7800 rpm for five minutes. 1 mL of each supernatant was filtrated into a 2-mL vial. All samples were injected in triplicate.
Results and Discussion
Harnessing the prescribed method parameters, Figure 1 displays an overlay of 12 replicates of the composite quantifier MRMs of the level-5 calibrant. All eight vitamins are resolved well, eluting in under four minutes, with the 12-replicate overlays exhibiting exceptional chromatographic reproducibility.
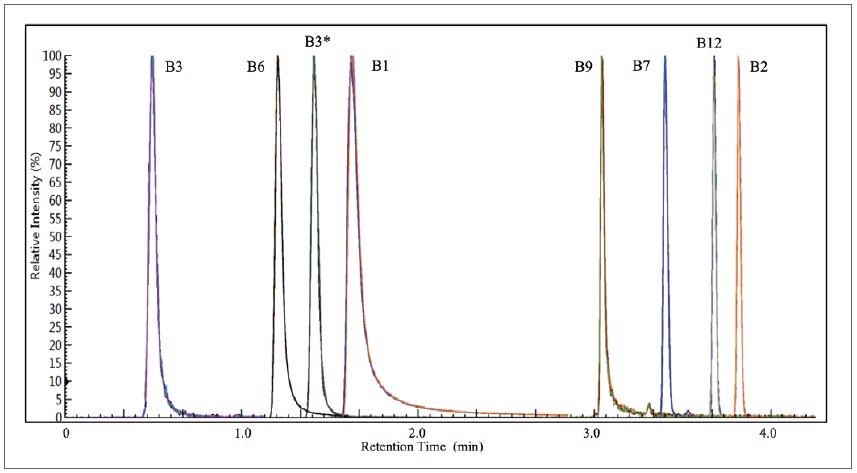
Figure 1. 12 replicate overlays of the combined quantifier MRMs of the level-5 calibrant. Image Credit: PerkinElmer Food Safety and Quality
Figure 2 displays examples of the calibration results for vitamins B1 and B12, demonstrating excellent fits (R2 = ≥ 0.999; n=3). For vitamins B2, B3*, B7 and B12, a 6-level calibration was used. In contrast, a 5-level calibration was used for vitamins B1, B3, B6 and B9.
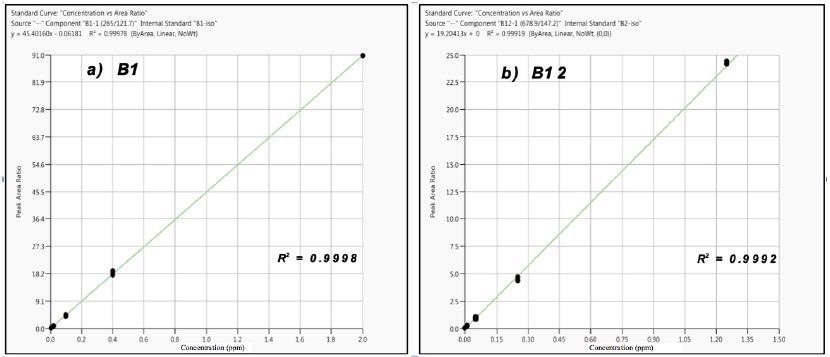
Figure 2. Calibration results for Vitamins B1 (a) and B12 (b); n= 3 at each level. Image Credit: PerkinElmer Food Safety and Quality
All eight vitamins had calibration fits > 0.996. Upon the injection of a diluent blank immediately after triplicate injections of the level-6 calibrant, no detectable carryover was seen for any of the eight vitamins. An example of carryover test results for vitamins B1and B12 is shown in Figure 3
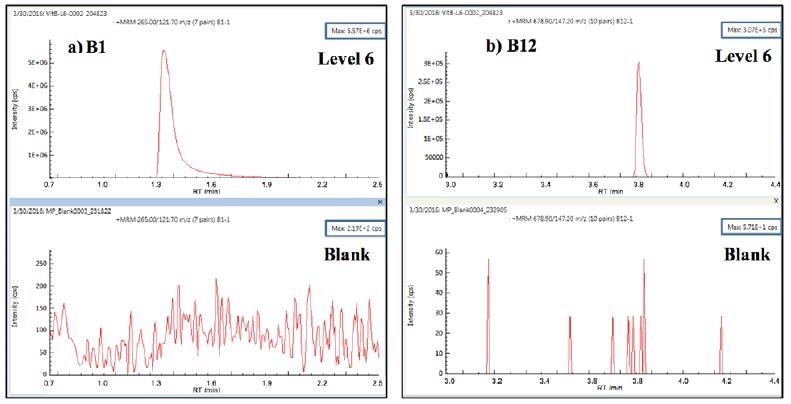
Figure 3. Carryover test MRM for vitamins B1 and B12: 3 replicate injections of level-6 calibrant followed by diluent blank. Image Credit: PerkinElmer Food Safety and Quality
Figure 4 displays the quantifier MRMs at the lowest quantitatable level for each analyte. Vitamins B1, B2, B3* and B6 were all measurable down to 0.004 µg/ml (4 ppb) and vitamin B12 was measurable down to 0.0005 µg/ml (0.5 ppb).
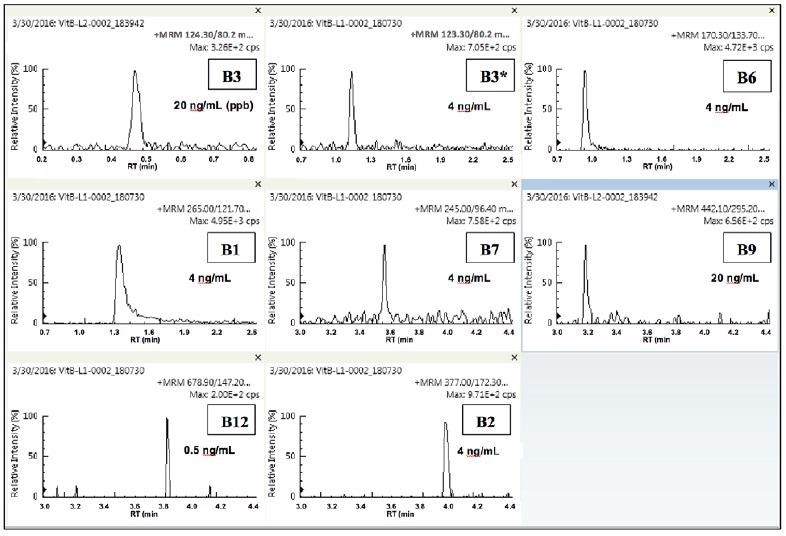
Figure 4. Quantifier MRMs of lowest quantitated level for each of the eight vitamins. Image Credit: PerkinElmer Food Safety and Quality
Vitamins B3 and B9 were measurable down to 0.02 µg/ml (20 ppb). All the analyzed vitamins were measurable within the expected guidelines as stipulated by the FDA. The quantitatable limits (LOQ or IDL) for vitamins B1, B6 and B2 are likely to be much lower.
Two commercially available infant formula powders, IF1 and IF2, were analyzed for the eight B-vitamins. Each sample was prepared as detailed above and injected in triplicate.
Figures 5-6 display the individual quantifier MRMs for each vitamin observed in the infant formula samples prepared. The two sample profiles appear to be similar, which was to be expected, bearing in mind that for this type of product, the label claims are usually similar.
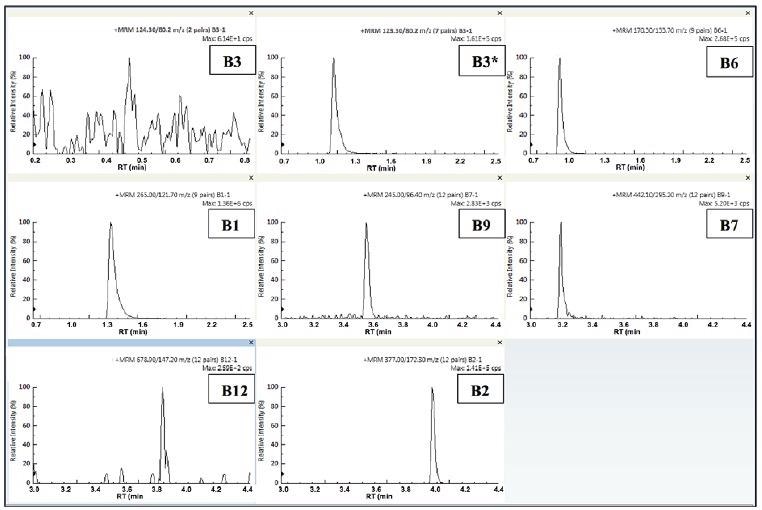
Figure 5. Quantifier MRMs for the 8 B-vitamins in IF1. Image Credit: PerkinElmer Food Safety and Quality
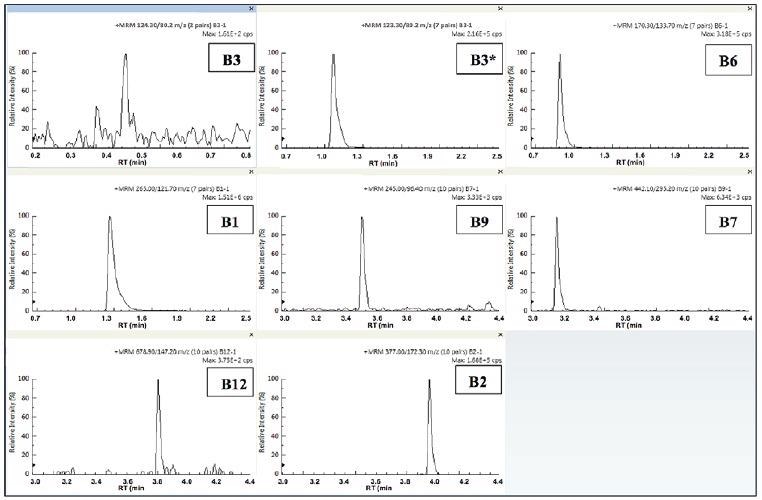
Figure 6. Quantifier MRMs for the 8 B-vitamins in IF2. Image Credit: PerkinElmer Food Safety and Quality
Sample reproducibility is shown in Figure 7, demonstrating the replicate MRMs for vitamins B2 and B12 in IF2. The reproducibility at the very low 1-2 ppb level of vitamin B12 was especially impressive.
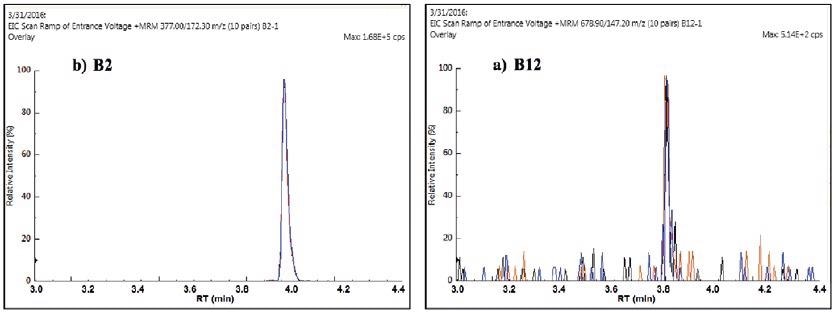
Figure 7. Replicate quantifier MRMs for vitamin B2 (a) and B12 (b) in IF2. Image Credit: PerkinElmer Food Safety and Quality
As displayed in Table 5, apart from vitamin B1in IF1, the concentrations calculated for the B-vitamins were all within an appropriate target range for the label claim of both infant formulas. The specific label claim values for B3 (niacin) and B3* (niacinamide) were not observed as these two vitamins are normally combined and grouped under “B3” or just “niacin”.
Table 5. Quantitative results for B-vitamins found in IF1 and IF2, as compared to label claim; n= 3. Source: PerkinElmer Food Safety and Quality
| Vitamin |
RT (min) |
IF1 |
IF2 |
| Conc. per label claim (µg/mL) |
Actual sample conc. ** (µg/mL) |
Difference from label claim (± %) |
Conc. per label claim (µg/mL) |
Actual sample conc. ** (µg/mL) |
Difference from label claim (± %) |
| B3 |
0.457 |
NA |
0.020 |
-- |
NA |
0.029 |
-- |
| B6 |
0.904 |
0.450 |
0.42 |
- 6.7 |
0.405 |
0.30 |
- 25.9 |
| B3* |
1.097 |
NA |
2.56 |
-- |
NA |
2.35 |
-- |
| B1 |
1.305 |
1.50 |
0.80 |
- 47 |
0.643 |
0.70 |
+ 8.9 |
| B9 |
3.180 |
0.195 |
0.17 |
- 12.8 |
0.103 |
0.13 |
+ 20.1 |
| B7 |
3.540 |
0.038 |
0.040 |
+ 5.3 |
0.030 |
0.033 |
+ 10.0 |
| B12 |
3.814 |
0.002 |
0.002 |
0.0 |
0.002 |
0.002 |
0.0 |
| B2 |
3.954 |
1.50 |
1.61 |
+ 7.3 |
1.029 |
0.98 |
- 4.8 |
** Average of three replicates
These two vitamins are recognized for their ability to inter-convert, making quantitatable comparisons difficult.2 The low value for vitamin B1 in IF1 may genuinely be real, as the value for IF2 was near to the label claim, even on the high side, indicating good vitamin B1 recovery expectations.
Overall, the results support excellent recovery performance in line with the provided sample preparation procedure for infant formula. To offer additional analyte confirmation, qualifier/quantifier ion ratios were also established.
As demonstrated in Table 6, the ion ratios for the quantitatable vitamins discovered in both infant formulas were all deemed to be within the tolerance window (± 20%) of the ion ratios determined for standards. Niacin (B3) concentration was found to be too low to be ratioed, as any vitamin B3 that was identified was predominantly niacinamide (B3*).
Table 6. Analyte ion ratios for IF1 and corresponding standard levels. Source: PerkinElmer Food Safety and Quality
| Vitamin |
MRMs used for Ion Ratio (amu) |
Ion Ratio |
% Difference (±) |
| IF1 |
Standard |
| B3* |
123.3/53.2
123.3/80.2 |
0.165 |
0.158 |
+ 4.4 |
| B6 |
170.3/105.8
170.3/133.7 |
0.046 |
0.045 |
+ 2.2 |
| B1 |
265.0/144.0
265.0/121.7 |
0.241 |
0.241 |
0.0 |
| B9 |
442.1/176.0
442.1/295.2 |
0.473 |
0.478 |
- 1.0 |
| B7 |
245.0/104.5
245.0/96.4 |
0.692 |
0.752 |
- 7.8 |
| B12 |
678.9/399.2
678.9/147.2 |
0.773 |
0.642 |
+ 20 |
| B2 |
377.0/198.2
377.0/172.3 |
0.802 |
0.773 |
+ 3.8 |
Conclusions
The results achieved, verify the relevance of an LC-MS/MS method for the efficient, routine and robust chromatographic evaluation of B-vitamins in infant formula.
This was achieved using a single MS method to establish and measure the eight water soluble vitamins over an extensive concentration range in less than four minutes. The results demonstrated excellent retention time repeatability, and the method had the capacity detect vitamin B12 at 0.5 ppb, far below the expected level of ~2 ppb in infant formulas.
References
- U.S. Food and Drug Administration (FDA), Guidance for Industry: A Food Labeling Guide (14. Appendix F), https://www.fda.gov/
- Nick Byrd, Campden BRI, United Kingdom

This information has been sourced, reviewed and adapted from materials provided by PerkinElmer Food Safety and Quality.
For more information on this source, please visit PerkinElmer Food Safety and Quality.