Isoflavones are a category of naturally occurring water-soluble compounds generated almost exclusively by members of the Fabaceae plant family.
Originating in a variety of plants and food sources, isoflavones occur in many forms, including aglycones (daidzein, glycitein and genistein), glucosides (daidzin, genistin and glycitin) and their acetyl and malonyl conjugates.
The aglycone species of isoflavones are biologically active, whereas the glucosides and conjugates experience hydrolysis by bacterial beta-glucosidases in the intestines, freeing the corresponding aglycones. Figure 1 shows the structure of the three aglycones, as well as their equivalent glucosides.
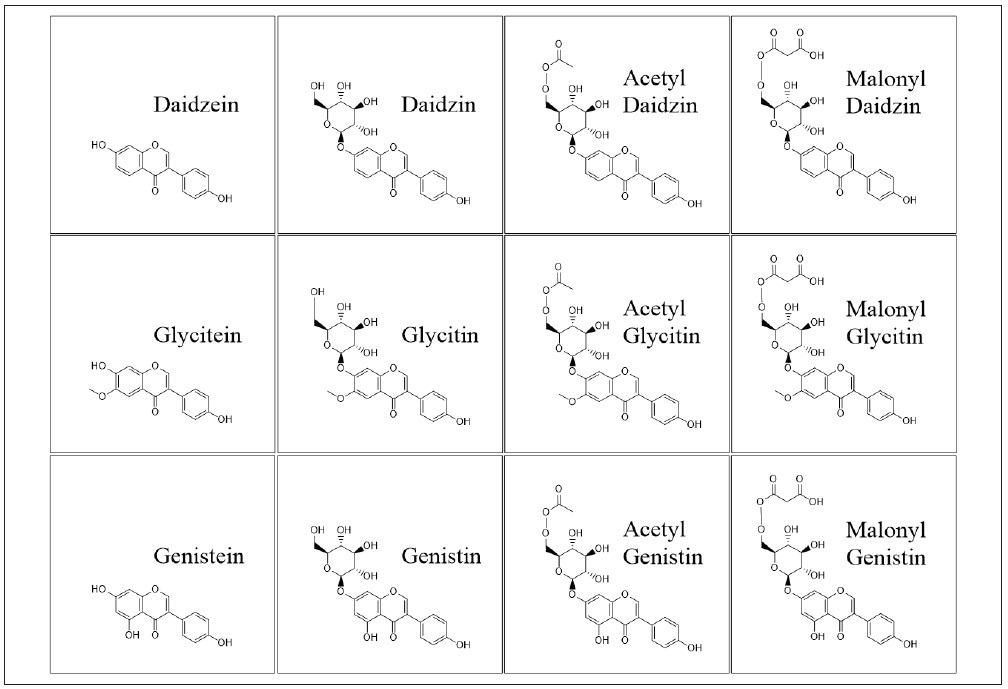
Figure 1. Chemical structures of the isoflavones analyzed in this study. Image Credit: PerkinElmer Food Safety and Quality
Similar in structure to the female hormone estrogen, isoflavones are classified as phytoestrogens, actively binding to estrogen receptors through the body.
Although the estrogenic effects of phytoestrogens are generally weaker than that of natural estrogen, the result can have both positive and negative effects on the human body.
Phytoestrogens have demonstrated the capacity to reduce the developmental potential of many cancers (such as breast, endometrial and prostate cancer), curb the onset of osteoporosis and boost the ratio of LDL to HDL cholesterol.1-4
However, studies also argue that the endocrine-disrupting nature of phytoestrogens can intensify existing thyroid disorders.5
Today, a wide range of isoflavone supplements are available on the market, a number of which are offered as nutraceuticals. Thus, to protect human health and ensure therapeutic levels of active ingredients are included in the supplements, confirming label-claim accuracy is crucial in developing and manufacturing nutraceutical products.
Both the United States Pharmacopeia (USP) and the Association of Official Agricultural Chemists (AOAC) have identified methods for the evaluation of isoflavones in various supplements by high-performance liquid chromatography (HPLC).6-8
However, these methods of analysis can be unworkable for high throughput laboratories and lead to the consumption of considerable amounts of solvents.
Although several analytical methods for isoflavones exist, the aim of this project is to advance a simpler, faster and more dependable liquid chromatography method for the evaluation of the most commonly used isoflavones in soy nutraceutical supplements. Method conditions are presented, which include performance data, such as linearity and repeatability.
Experimental
Hardware and Software
Chromatographic separation was accomplished using the PerkinElmer LC 300 UHPLC system, comprised of an LC 300 18k psi UHPLC pump, an LC 300 UHPLC autosampler with a temperature-controlled sample compartment, and an internal column oven.
Detection was accomplished by an LC 300 photodiode array detector (PDA). Instrument control, analysis and data processing were conducted using the Simplicity™Chrom CDS software platform.
Method Parameters
The LC parameters are described in Table 1.
Table 1. LC Parameters. Source: PerkinElmer Food Safety and Quality
| . |
. |
| Column |
PerkinElmer Brownlee SPP C18, 2.7 µm, 75 x 2.1 mm (Part# N9308403) |
| Mobile Phase |
Solvent A: HPLC or LC/MS Grade Water with 0.1% Formic Acid
Solvent B: HPLC or LC/MS Grade Acetonitrile with 0.1% Formic Acid
Solvent Program: Linear Gradient
| Step |
Time
(min.) |
Flow Rate
(mL/min.) |
%A |
%B |
| 1 |
0.00 |
0.600 |
88 |
12 |
| 2 |
0.10 |
0.600 |
88 |
12 |
| 3 |
6.00 |
0.600 |
70 |
30 |
| 4 |
6.99 |
0.600 |
70 |
30 |
| 5 |
7.00 |
0.600 |
88 |
12 |
|
| Analysis Time |
7.0 min. |
| Equilibration Time |
2.0 min. |
| Pressure |
~5500 psi/380 bar maximum |
| Oven Temp. |
30 ºC |
| Sample Temperature |
Ambient |
| Injection Vol. |
5 µL |
| Detection Wavelength |
260 nm Bandwidth 15 nm Reference Wavelength: 400 Bandwidth 40 nm |
| Data Collection Rate |
5 pts/sec (Hz) |
Solvents and Standard Preparation
All solvents and diluents utilized were HPLC or LC/MS grade. The three aglycone and three glucoside standards were acquired from Sigma-Aldrich®, Inc (St. Louis, MO) in powder form.
These standards contained daidzin, daidzein, genistin, genistein, glycitin and glycitein. USP defatted powdered soy reference material was also acquired from Sigma-Aldrich®, Inc (St. Louis, MO).
Preparation was completed by dissolving 5-10 mg of each standard into acetonitrile in single stock solutions of approximately 400 µg/mL. A mixed standard solution was prepared by joining appropriate aliquots of the individual stock solutions, and diluting to the final volume with water and acetonitrile so that the solvent was 50:50 water:acetonitrile.
Preparation of the calibrants was carried out by serially diluting the mixed standard with 75:25 water:acetonitrile. The final concentrations of the standards are displayed in Table 2 below.
Table 2. Group A compounds are daidzin, daidzein, genistin and genistein. Group B compounds are glycitin and glycitein. Source: PerkinElmer Food Safety and Quality
| Solution Name |
Group A Conc.
(µg/mL) |
Group B Conc.
(µg/mL) |
| STD-A |
10.00 |
5.000 |
| STD-B |
5.000 |
2.500 |
| STD-C |
2.500 |
1.250 |
| STD-D |
1.250 |
0.6250 |
| STD-E |
0.6250 |
0.3125 |
| STD-F |
0.3125 |
0.1563 |
| STD-G |
0.1563 |
0.07813 |
| STD-H |
0.07813 |
0.03906 |
USP defatted powdered soy reference material was used for the preparation of acetyl and malonyl retention time check solutions, as described in the USP monograph for soy isoflavone capsules.
One 200 mg portion was warmed in an open container at 120 °C for two hours. A second portion of the reference material was easily weighed into a suitable vial. Both were prepared, including 2 mL acetonitrile and 1.2 mL water, followed by one hour of mixing.
An additional 1.8 mL of water was introduced to each vial, mixed thoroughly, centrifuged, and filtered using a 0.45-µm PVDF filter. Aliquots were diluted further 1:1 with water before the analysis.
Sample Preparation
Three distinct dietary supplements, including soy isoflavones, were acquired from a local health food store. One included only the soy isoflavones of interest, while the other two included a range of supplemental herbal ingredients.
The contents of each supplement were pooled and weighed from five capsules. An amount of the pooled material was weighed to provide around 5 mg of isoflavone predicated on the label-claim amount.
The samples were prepared as detailed in the USP monograph by adding 10 mL acetonitrile and 6 mL water, followed by mixing for one hour.6 An additional 9 mL of water was introduced to each vial, mixed thoroughly, centrifuged and filtered utilizing a 0.45-µm PVDF filter. Aliquots were diluted further with water at 1:1 prior to analysis.
Results and Discussion
The chromatogram of the high concentration standard (Std-A, 10.0/5.0 μg/mL) is displayed in Figure 2. Figure 3 shows the chromatogram of the heated sample of the defatted soy powder as reference material.
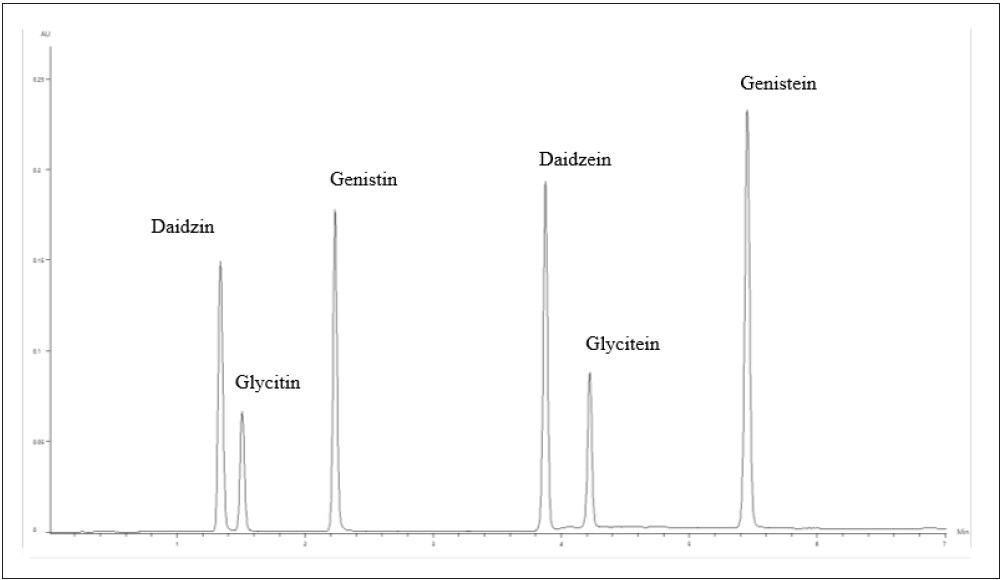
Figure 2. Chromatogram of the 10.0/5.0-μg/mL isoflavone standard. Image Credit: PerkinElmer Food Safety and Quality
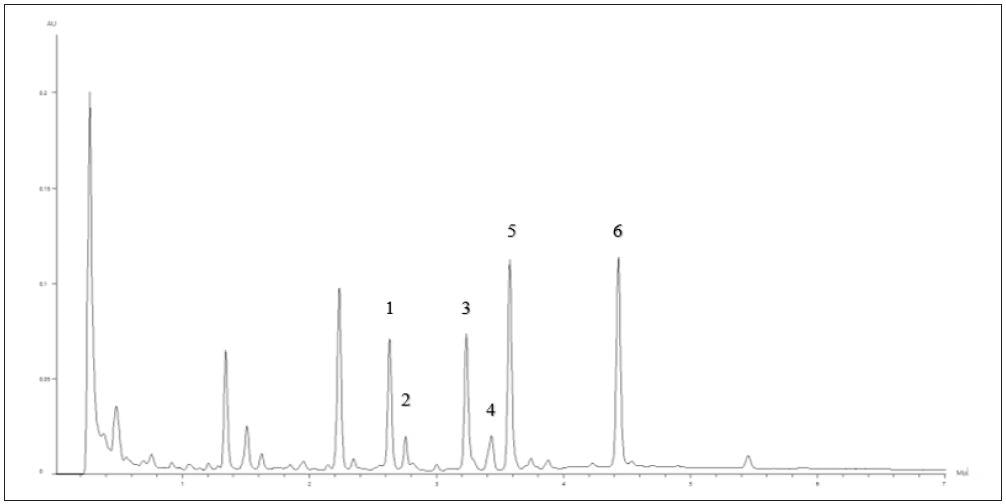
Figure 3. Heated USP Defatted Powdered Soy showing peak identification: 1) Malonyl Daidzin 2) Malonyl Glycitin 3) Acetyl Daidzin 4) Acetyl Glycitin 5) Malonyl Genistin 6) Acetyl Genistin. Image Credit: PerkinElmer Food Safety and Quality
This, in conjunction with the nonheated sample, was used to determine the retention times of the acetyl and malonyl conjugated forms of the isoflavones. These compounds are considered to be unstable, and reference standards are not easily accessible.
Since these compounds were not included in the calibration standards, the amounts were calculated using the method detailed in the USP monograph.
The equivalent glucoside calibration curve was used to calculate a concentration which was augmented using a correction factor. Figure 4 displays the overlay of six replicate 2.5/1.25-µg/mL isoflavone standard injections, showing excellent reproducibility.
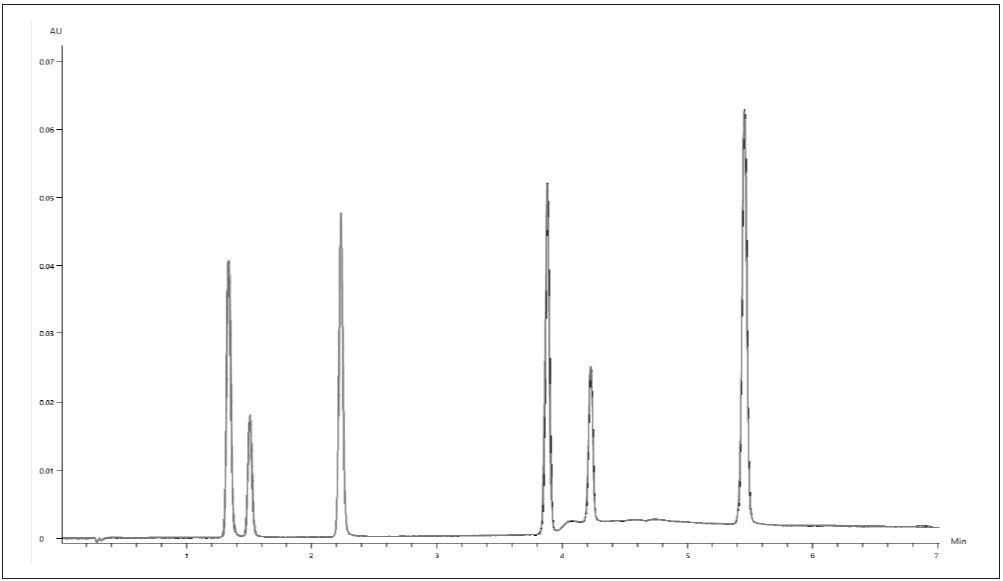
Figure 4. Chromatographic overlay of 6 replicates of the 2.5/1.25-μg/mL isoflavone standard. Image Credit: PerkinElmer Food Safety and Quality
Retention time repeatability was less than 0.01 min, and peak area %RSDs were less than 0.5% for all analytes.
Figure 5 shows the calibration results for all six isoflavone compounds over the range of concentrations tested. All six compounds demonstrated a good linear (1st order) fit and had R2 coefficients greater than 0.999.
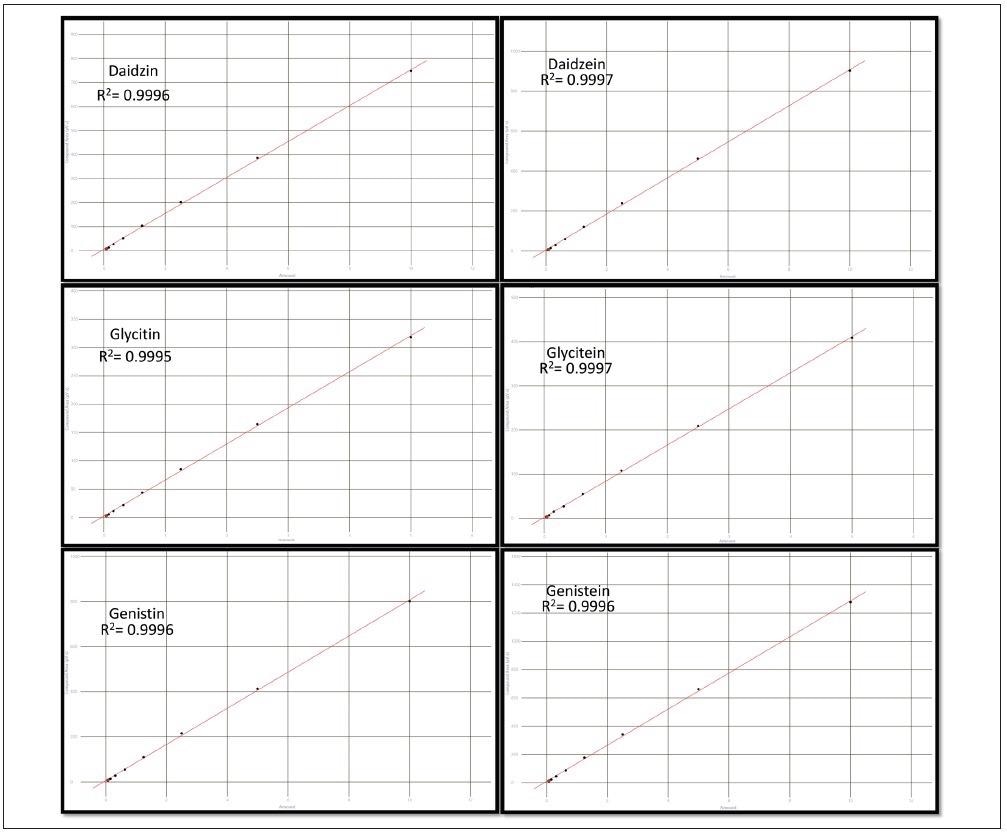
Figure 5. Results of the 8-level calibration sets for the three glucoside and three aglycone isoflavones. Image Credit: PerkinElmer Food Safety and Quality
As indicated in Table 3, the limit of detection (LOD) and limit of quantitation (LOQ) were recorded for each analyte and calculated from the standard deviation of the response measured at the low standard (STD-H, n=6) and the slope of the calibration curve for each analyte.
Table 3. LODs and LOQs for the six analytes, in order of elution. Source: PerkinElmer Food Safety and Quality
| Analyte |
Calculated LOD
(µg/mL) |
Calculated LOQ
(µg/mL) |
| Daidzin |
0.0099 |
0.0330 |
| Glycitin |
0.0063 |
0.0209 |
| Genistin |
0.0092 |
0.0306 |
| Daidzein |
0.0028 |
0.0095 |
| Glycitein |
0.0062 |
0.0208 |
| Genistein |
0.0026 |
0.0085 |
Sample Results
Using the same chromatographic conditions, three of the supplement samples prepared were then analyzed. The chromatographic results for supplements A and B were visually similar, with a majority of the isoflavone content in the shape of the glucosides daidzin and genistin, as displayed in Figure 6.
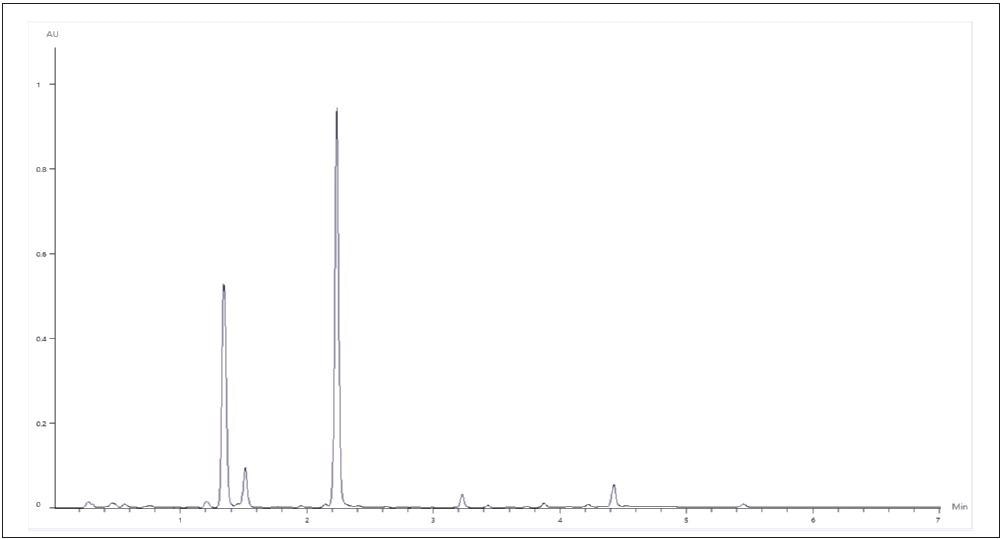
Figure 6. Representative Chromatogram of Supplements A and B. Image Credit: PerkinElmer Food Safety and Quality
Sample C demonstrated varying relative concentrations of the measured analytes, distinctly at a higher proportion of acetyl and malonyl conjugated glucosides, as exhibited in Figure 7.
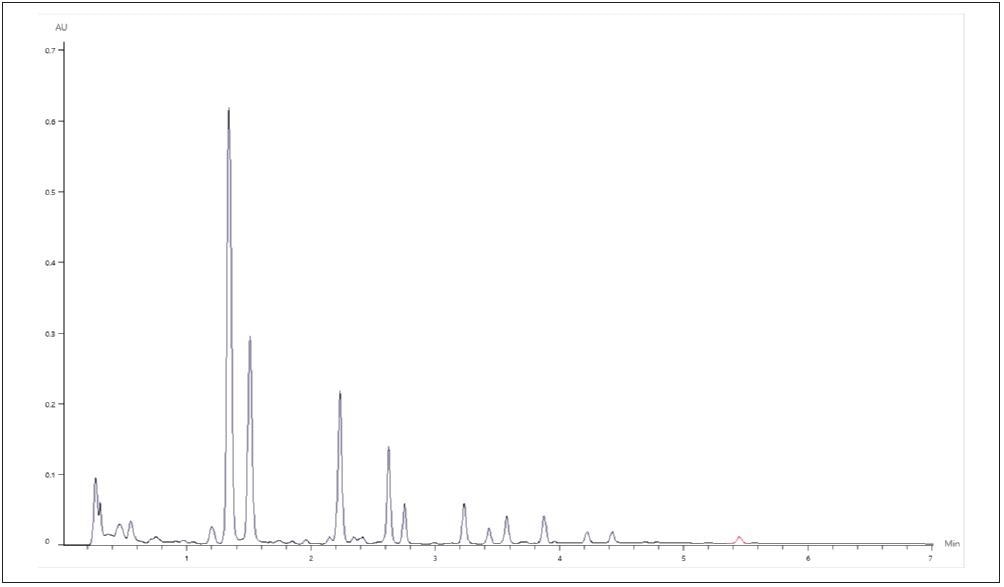
Figure 7. Representative Chromatogram of Supplement C. Image Credit: PerkinElmer Food Safety and Quality
Quantitative results for the three capsule samples are displayed in Table 4 below. Samples A and B demonstrated similar profiles, both chromatographically and quantitatively.
Both products are manufactured by the same manufacturer and detail the same ingredient source. Sample C is manufactured by a different manufacturer and lists an ingredient source that differs.
Table 4. Detected isoflavone concentrations in the three samples. Source: PerkinElmer Food Safety and Quality
| Analyte |
Sample A
(µg/mL) |
Sample B
(µg/mL) |
Sample C
(µg/mL) |
| Daidzin |
76.6a |
67.9a |
84.8a |
| Glycitin |
10.3a |
14.4a |
47.3a |
| Genistin |
106a |
105a |
25.0a |
| Malonyl Daidzin |
0.364 |
0.378 |
18.1 |
| Malonyl Glycitin |
0.156 |
0.134 |
8.04 |
| Acetyl Daidzin |
4.74 |
4.10 |
7.51 |
| Acetyl Glycitin |
0.520 |
0.723 |
3.23 |
| Malonyl Genistin |
ND |
ND |
4.98 |
| Daidzein |
0.941 |
0.887 |
3.794 |
| Glycitein |
0.351 |
0.512 |
1.74 |
| Acetyl Genistin |
7.45 |
6.39 |
1.64 |
| Genistein |
0.540 |
0.481 |
0.637 |
| Total Isoflavone |
208 |
201 |
207 |
| Label Claim Isoflavone (per weight) |
202 (26.1 mg) |
203 (43.3 mg) |
202 (189.5 mg) |
| Percent of Label Claim |
103% |
99.1% |
102% |
The three glucoside compounds in each sample were measured above the high calibration standard. Therefore, the extrapolated values are provided based on the linearity of the curve range tested and the known wide linear range of the LC 300 PDA detector.
Conclusion
This study has revealed how the PerkinElmer LC 300 18K UHPLC system with PDA detection performs rapid, robust chromatographic separation and quantitation of soy isoflavones, including glucoside, acetyl-glucoside and malonyl-glucoside conjugates.
The results demonstrate exceptional retention time repeatability, as well as superb linearity and reproducibility over the concentration range tested.
Samples were prepared in line with the USP monograph for soy isoflavones in dietary supplement capsules, and the analytical results were in accordance with the label claim for each sample.
The method yields LOQs ≤ 0.03µg/mL for most analytes, four times lower than the level detected for any analyte in the three samples.
References
- Linus Pauling Institute, Micronutrient Information Cetner at Oregon State University. https://lpi.oregonstate.edu/. Accessed March 2020.
- Anderson JW, Johnstone BM, Cooke-Newell ME. Meta-analysis of the effects of soy protein intake on serum lipids. N Eng J Med. 1995;333:276-281.
- Baum JA, Teng H, Erdman JW Jr, et al. Long-term intake of soy protein improves blood lipid profiles and increases mononuclear cell low-density-lipoprotein receptor messenger RNA in hypercholesterolemic, postmenopausal women. Am J Clin Nutr. 1998;68:545-551.
- Marini H, Minutoli L, Polito F, et al. Effects of the phytoestrogen genistein on bone metabolism in osteopenic postmenopausal women. Ann Intern Med. 2007;146:839-847.
- Sathyapalan, Thozhukat, et al. “The Effect of Soy Phytoestrogen Supplementation on Thyroid Status and Cardiovascular Risk Markers in Patients with Subclinical Hypothyroidism: A Randomized, Double-Blind, Crossover Study.” The Journal of Clinical Endocrinology &; Metabolism, vol. 96, no. 5, 2011, pp. 1442–1449., doi:10.1210/jc.2010-2255.
- USP Monograph Soy Isoflavones Capsules; page reference USP43-NF38 – 5276; document ID GUID-683A08A4-E4C7- 4DB4-A080-B97DFF5500C3_1_en-US.
- Collison, Mark W., Determination of Total Soy Isoflavones in Dietary Supplements, Supplement ingredients and Soy Foods by High-Performance Liquid Chromatogrphy with Ultraviolet Detection: Collaborative study. J AOAC Int. 2008; 91(3) 489- 500. Accessed Online March 2020.
- Daems, Frederic, Analytical methods used to quantify isoflavones in cow’s milk: a review. Dairy Sci. & Technol. 2016 96:261-283.
This information has been sourced, reviewed and adapted from materials provided by PerkinElmer Food Safety and Quality.
For more information on this source, please visit PerkinElmer Food Safety and Quality.