In 2012, the European Food Safety Authority (EFSA) flagged mineral oil hydrocarbons (MOH) as a potential health concern, and since then, food contamination with these substances has been a major concern.1
In general, MOH fall into two main sub-classes: Mineral Oil Saturated Hydrocarbons (MOSH), which include linear, branched and alkyl-substituted cycloalkanes; and Mineral Oil Aromatic Hydrocarbons (MOAH), which mainly include alkyl-substituted (poly) aromatic hydrocarbons, for example, alkyl benzenes, alkyl naphthalenes, etc.
Researchers have proposed two analytical methods thus far to quantify these substances: (1) an off-line method that involves a solid phase extraction (SPE), followed by a GC-FID analysis; and (2) the most common, online LC-GC-FID method.
Based on the matrix, both techniques sometimes cause inaccuracies and present challenges from a qualitative/quantitative perspective because of the lack of an associated confirmatory method (i.e. GC-MS, GCxGC-MS).
In this regard, LECO’s Pegasus® BT 4D GC×GC-TOFMS system can help unravel the complexity of contaminated food samples and offer excellent chromatographic resolution and identification capabilities. As recommended by the EFSA, the GCxGC-MS technology should be employed as a confirmatory tool when the results are uncertain.
The extraordinary resolution power of the Pegasus® BT 4D GC×GC-TOFMS system helps differentiate the MOSH from the Polyolefin Oligomeric Saturated Hydrocarbons (POSH), and/or MOAH from the biogenic substances, like the terpenoids.
In fact, both the POSH and the terpenoids are denoted as interferents and can be erroneously quantified as MOSH or MOAH through the traditional methodologies (i.e. LC-GC-FID), which in turn causes erroneous results.
Besides the increased identification confidence and separation power, the “Classifications” feature of the LECO ChromaTOF® software can be used regularly to quickly collect information from the samples regarding the occurrence of a particular chemical class, like steranes or hopanes, or the recently highlighted 3-7 rings from MOAH.2
This article illustrates a GCxGC-TOFMS workflow to isolate and recognize the MOSH/MOAH fractions from the biogenic substances that often occur in a spice sample, i.e., cumin.
Experiment
A cumin extract was acquired and the spice was pre-separated into separate MOSH and MOAH fractions. Each fraction was concentrated (to ~100 µL) through sequential analytical runs. The concentrated fractions were individually injected into the BT 4D GCxGC-TOFMS system through the direct Pegasus LC-GC fractionation and coupling approach.
Before performing spice analysis, the same procedure was employed to inject a standard sample, called VGO-IS that constitutes a petroleum fraction spiked with the MOSH/MOAH Internal Standard (Restek Corporation, #31070), as a reference.
Table 1 shows the experimental parameters of the GCxGC-TOFMS.
Table 1. Source: LECO Corporation
| GCxGC |
LECO GCxGC QuadJet™ Thermal Modulator |
| Injection |
2 μL, Splitless mode (330 °C) |
| Columns |
1D: Rxi-17 SilMS, 12 m x 0.25 mm i.d. x 0.25 μm coating (Restek)
2D: Rxi-1-HT, 1.05 m x 0.25 mm i.d. x 0.25 μm coating (Restek) |
| Carrier Gas |
He; 1 ml/min constant flow |
| Oven Program |
40 °C (hold 1 min), ramp 5 °C/min to 360 °C, hold 10 min |
| Secondary Oven |
+7 °C |
| Modulation (PM) |
5 s |
| Transfer Line |
340 °C |
| MS |
LECO Pegasus BT 4D |
| Ion Source Temp |
280 °C |
| Mass Range |
40-700 |
| Acquisition Rate |
200 spectra/s |
Results and Discussion
By analyzing the VGO-IS reference sample (achieved by mixing a Vacuum Gas Oil; VGO- carbon range >C50-) with the MOSH/MOAH Internal standards allowed a reference contour plot to be developed, which included all the most relevant chemical classes to be analyzed in the MOSH/MOAH field.
The GCxGC contour plot obtained by injecting this sample is illustrated in Figure 1.
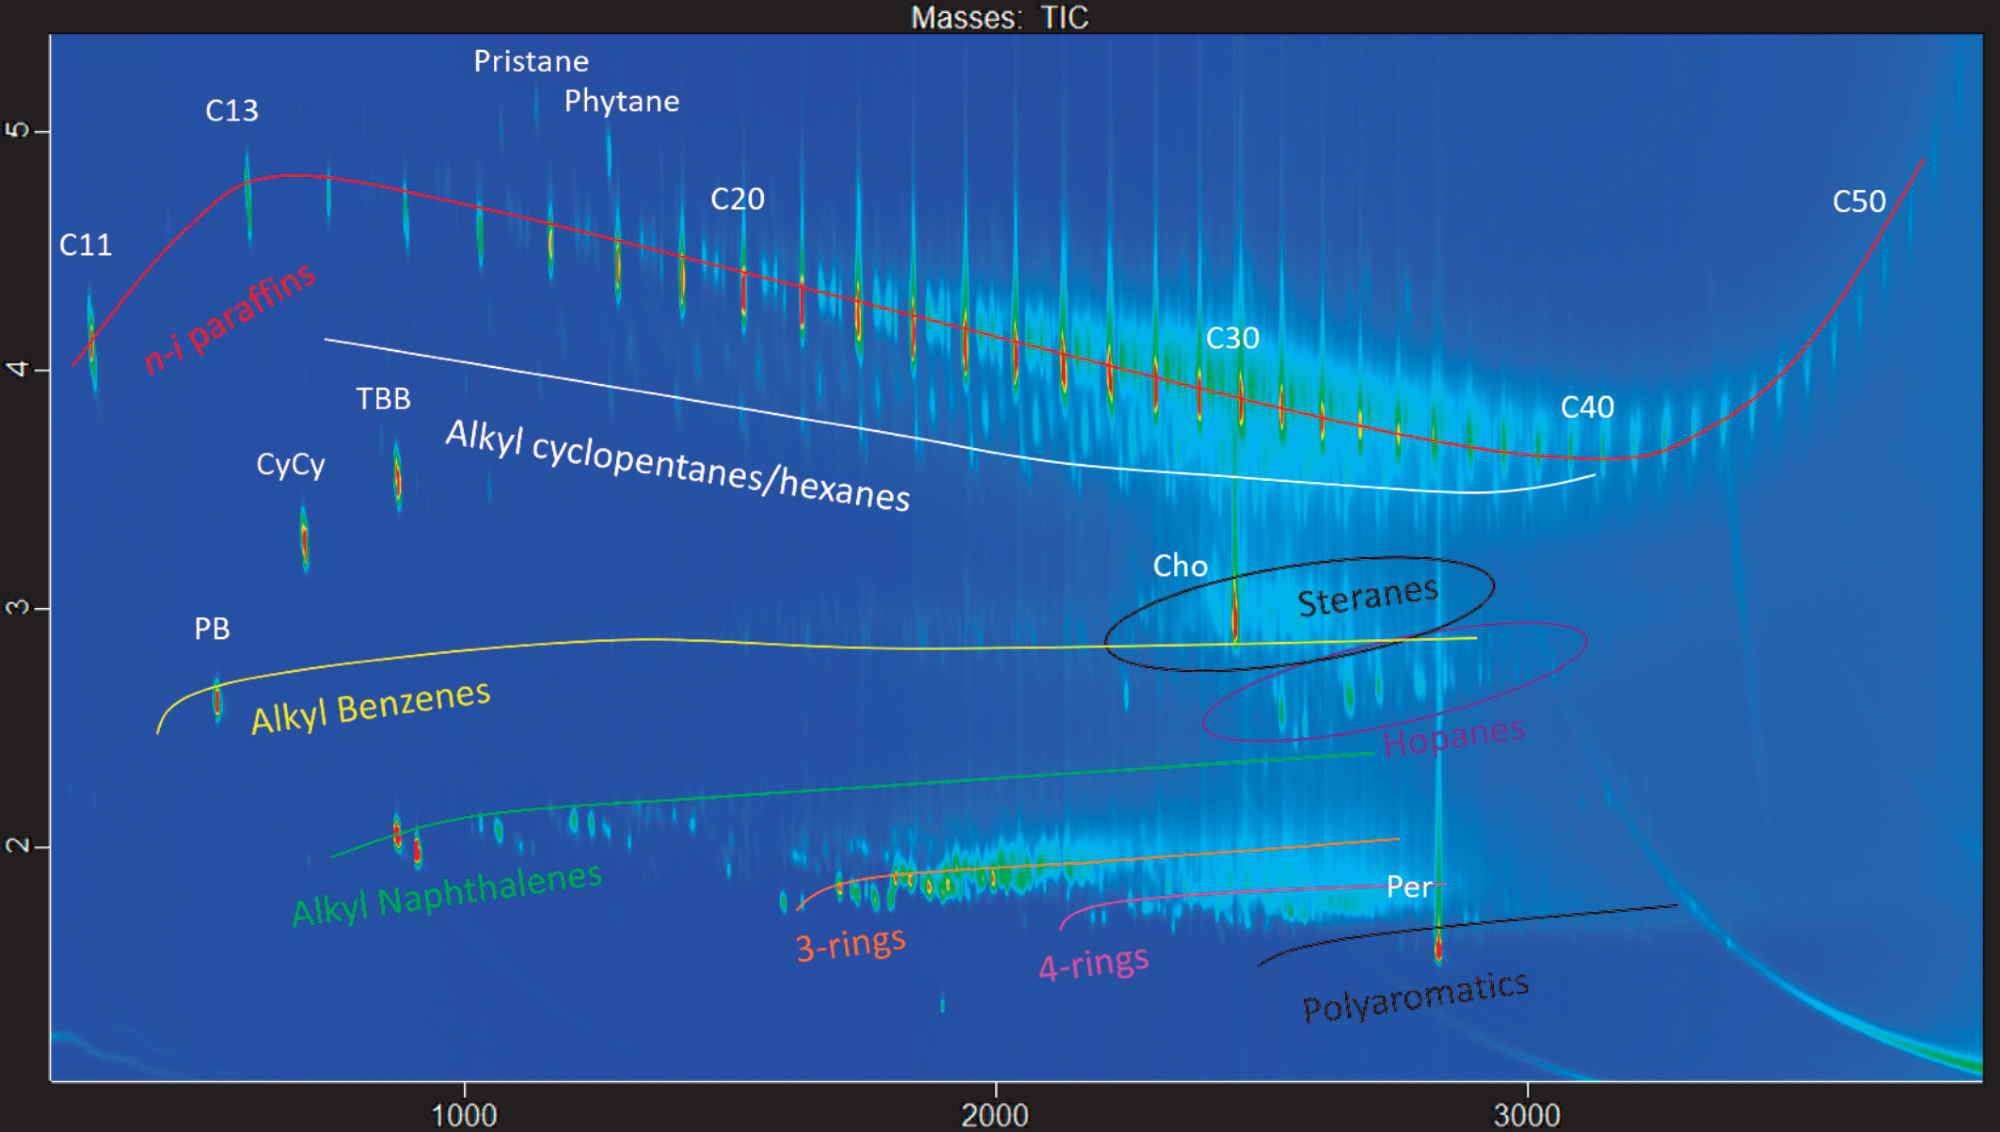
Figure 1. GCxGC-TOFMS contour plot from the VGO sample + the MOSH/MOAH internal standards (VGO-IS). Image Credit: LECO Corporation
From Figure 1, it is evident that the exceptional power of the GCxGC technology enables the isolation of various classes of components, leading to a highly structured contour plot.
A reverse column setup was selected for the analysis due to its specific capability to resolve chemical classes that are otherwise challenging to isolate through the traditional “normal” setup (for example, separating n-i paraffins from the POSH).
Moreover, the reverse setup enables clear isolation of hopanes (m/z 191), regarded as proof of mineral oil contamination. In general, these markers occur in trace amounts and are very hard to separate and/or identify through the LC-GC-FID methodology.
However, the combination of GCxGC and TOFMS technology enables these markers to be resolved clearly and exhibits a highly characteristic pattern of elution. This is the same in the case of steranes, which elute somewhat above the hopanes and can be targeted easily using the m/z 217.
Lastly, the separation capabilities within the MOAH fraction were also accurately assessed to ensure sufficient separation of the aromatic ring structures in the fraction. This was essential as per the EU’s latest recommendation in 2019, which emphasizes the significance of the 3-7 ring polycyclic aromatic compounds (3-7 PAC) from a toxicological perspective.
After analyzing the reference sample, the MOAH and MOSH fractions from the cumin extract were also analyzed with the same BT 4D GCxGC-TOFMS system configuration and data analysis technique.
In the analysis, the main scope was for Pegasus to monitor for the occurrence of the MOSH and MOAH contaminations as well as the interferents, which might have influenced the LC-GC-FID quantification results.
The occurrence of hopanes in the MOSH fraction of the cumin is depicted in Figure 2, which confirms the presence of mineral oil contamination.
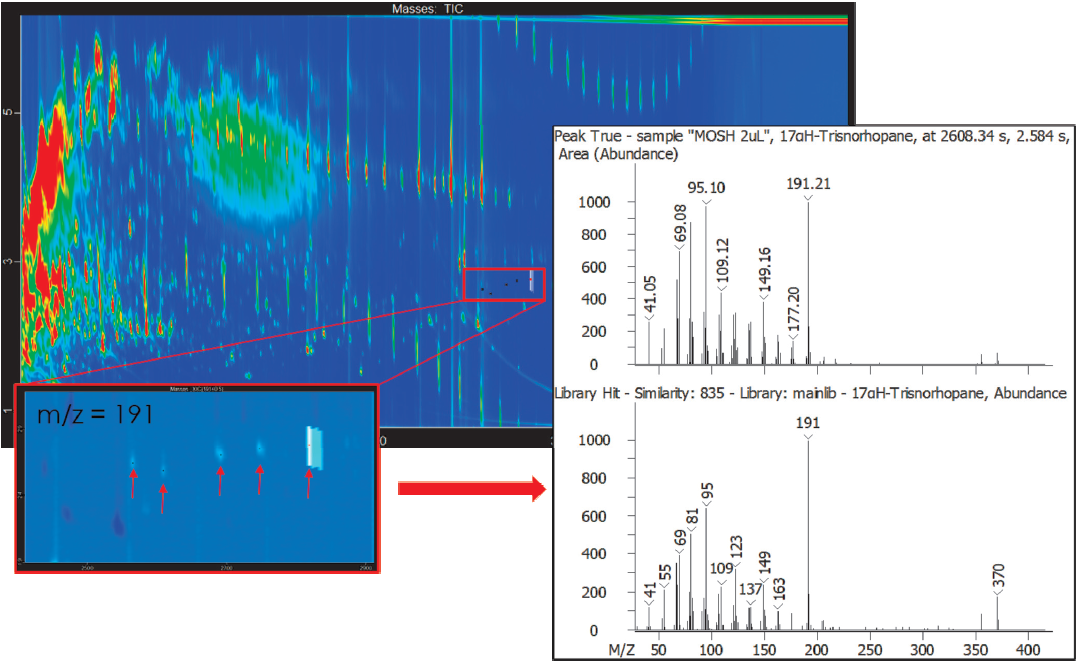
Figure 2. Hopanes detection in the cumin MOSH fraction (m/z 191.21). Image Credit: LECO Corporation
By contrast, Figure 3 illustrates the occurrence of particular MOAH markers like the Dibenzothiophenes (DBT) and the Diisopropylnaphthalnes (DIPN) that originate, most likely, from the jute bags used for the transportation of the spice after the harvest and the cardboard ink of the packaging, respectively.
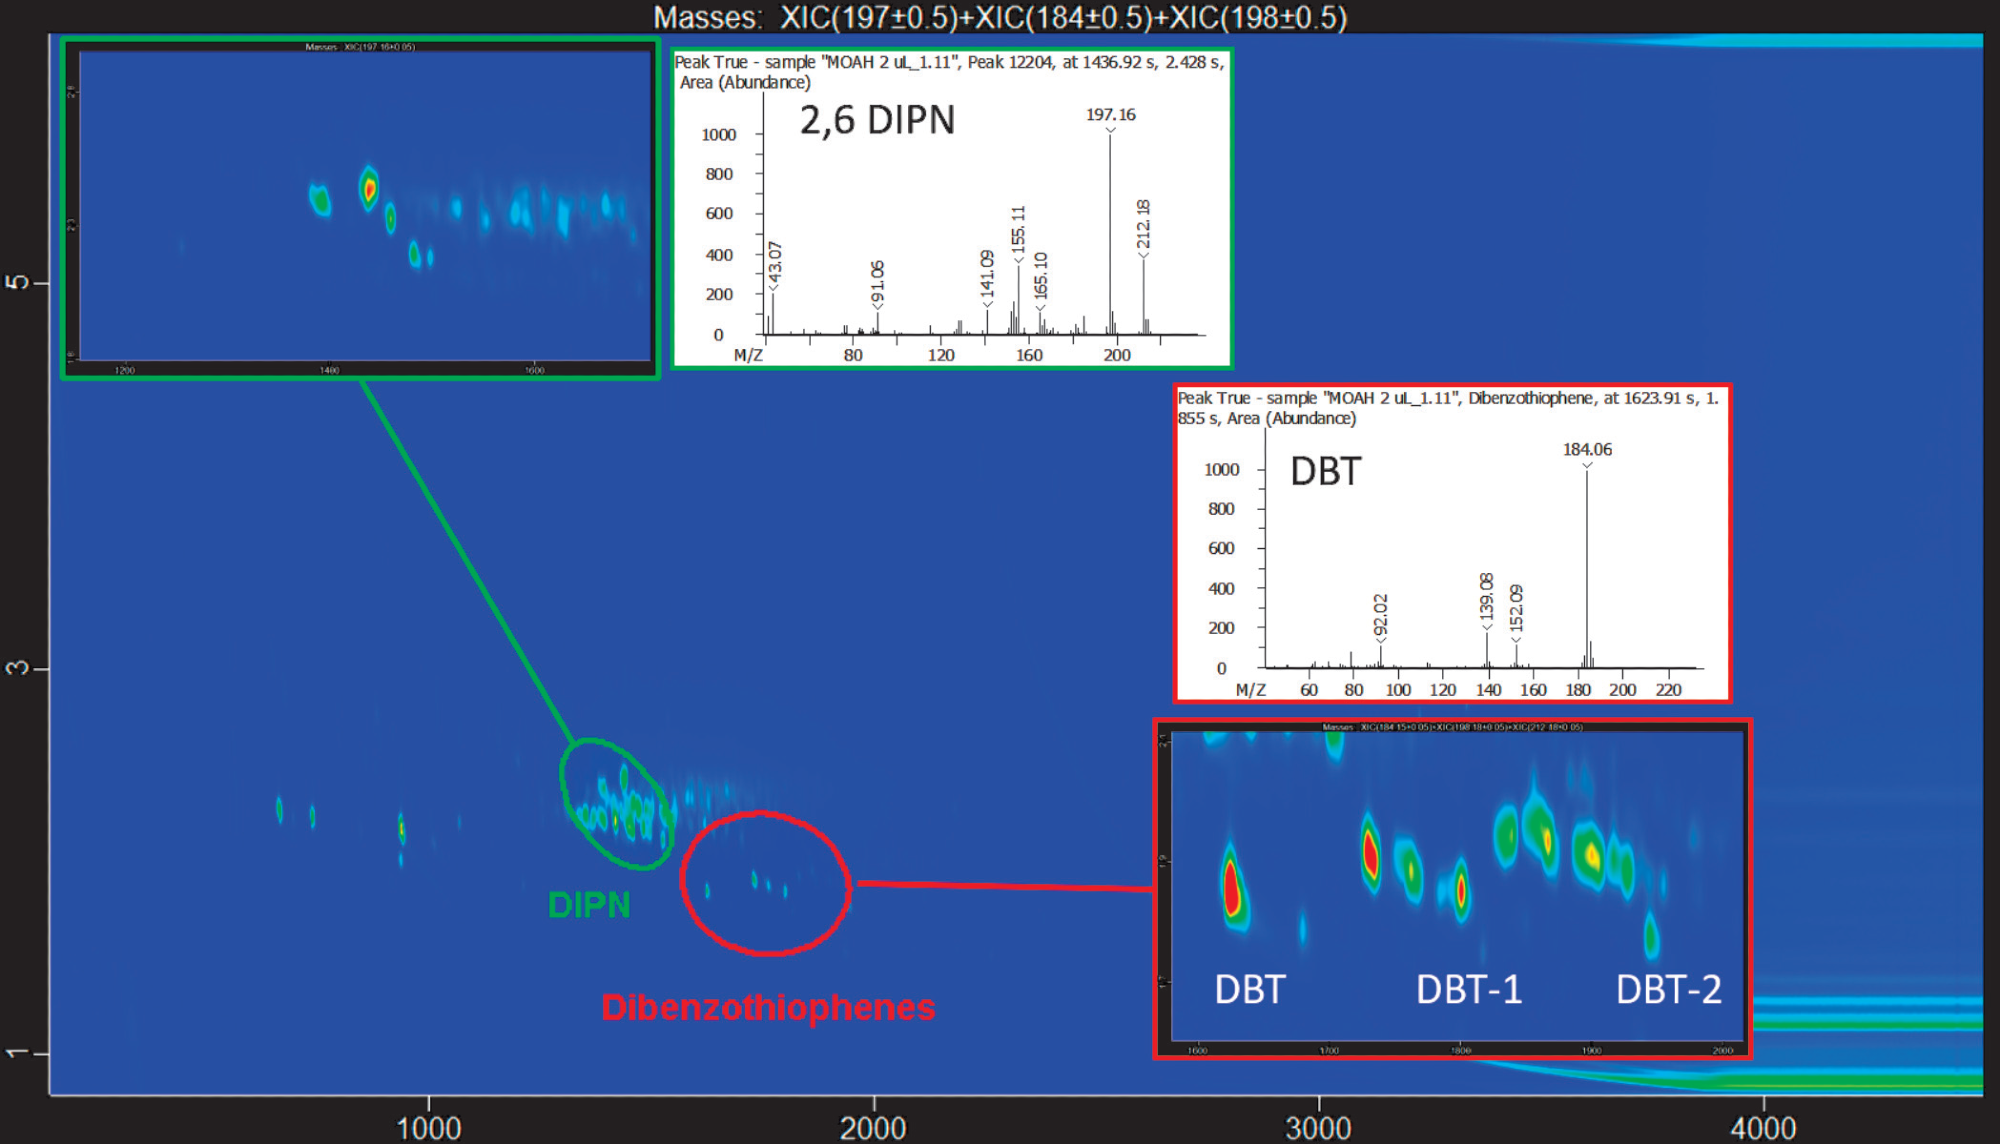
Figure 3. Detection and Classification of the DIPN and Dibenzothiophene (DBT) in the MOAH fraction from cumin. Image Credit: LECO Corporation
The occurrence of the aromatic compounds was confirmed along with these markers of contamination. For example, the classification of mono-, di- and tri-aromatic hydrocarbons within the MOAH fraction is shown in Figure 4.
LECO’s ChromaTOF “Classifications” feature helped detect all these chemical families automatically, which were established earlier using the VGO-IS as a reference standard.
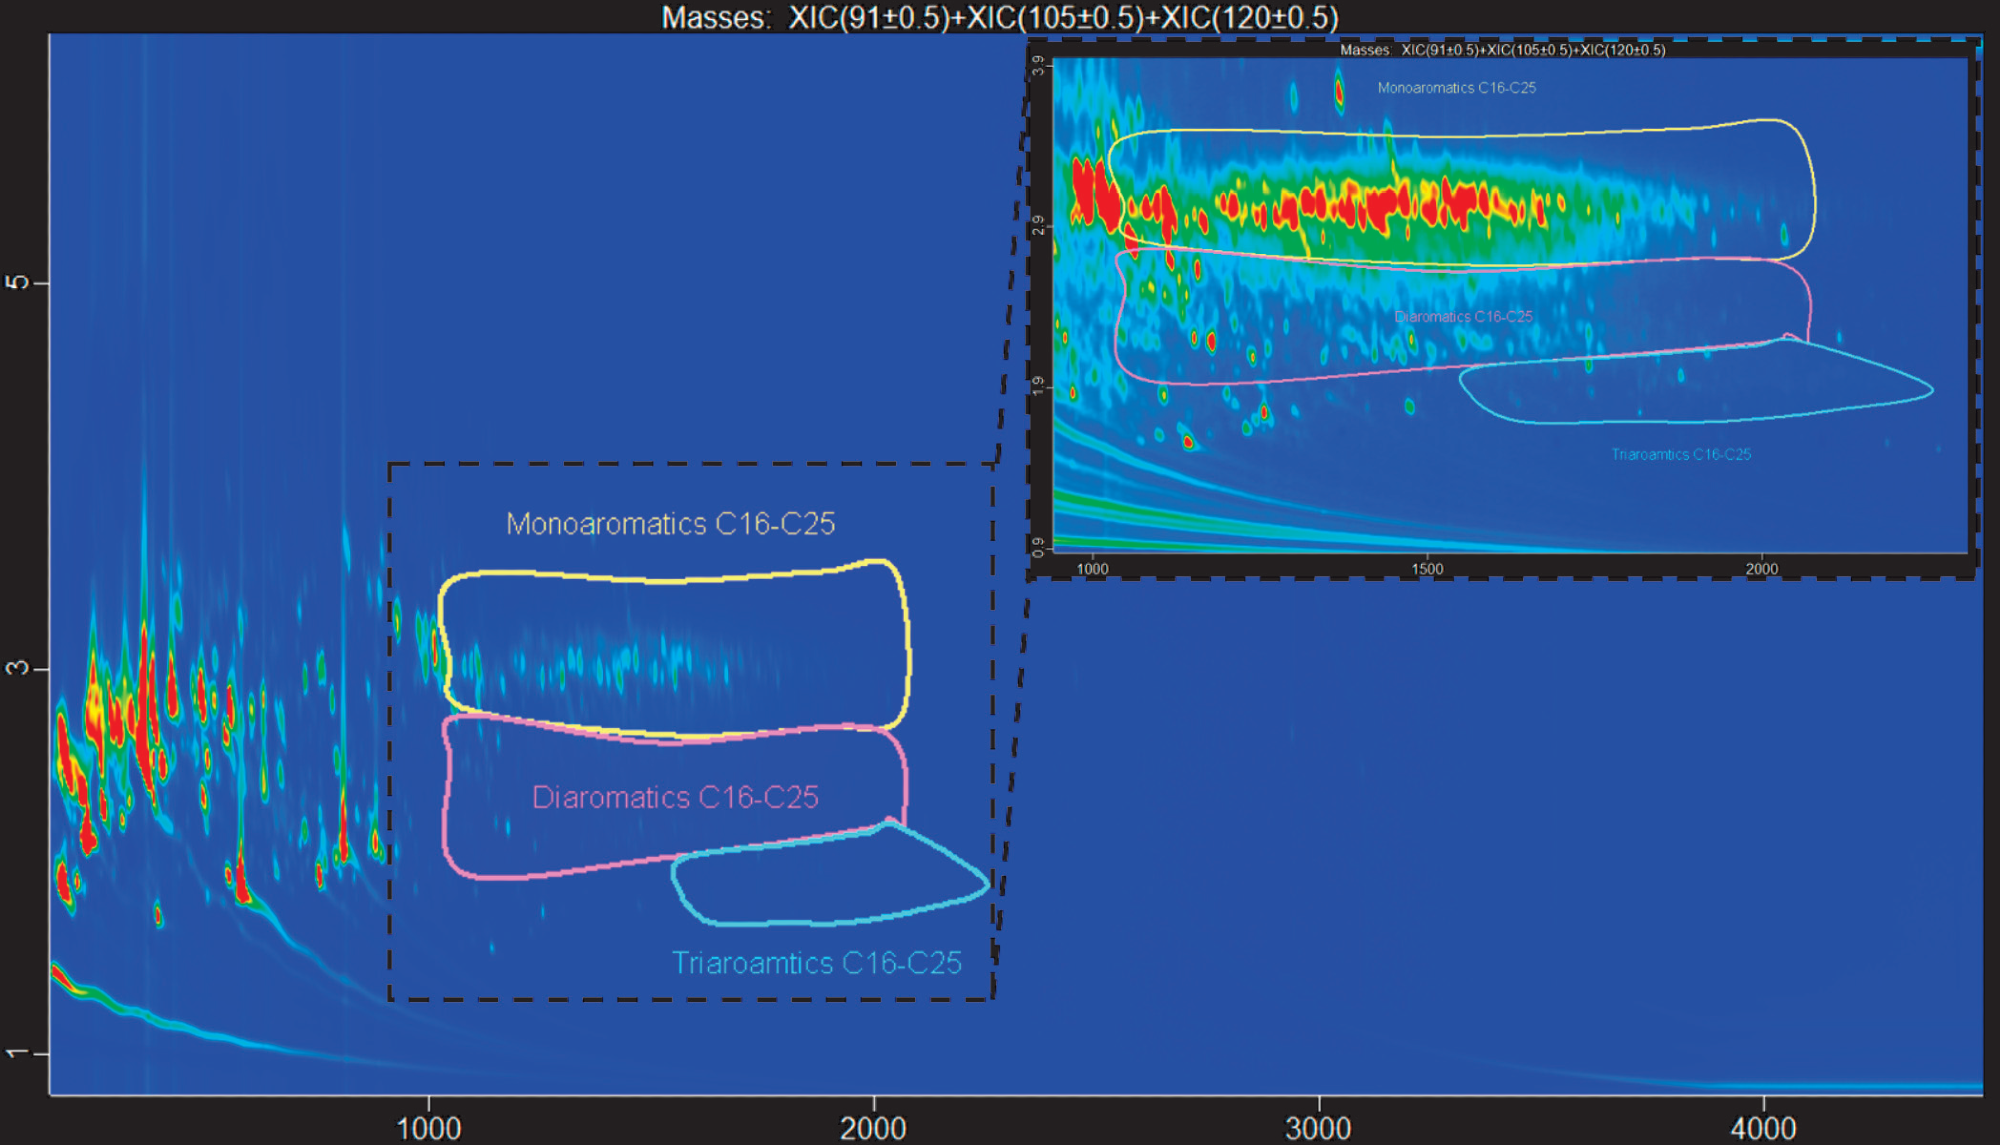
Figure 4. Detection and Classification of mono-, di-, and tri-rings aromatic hydrocarbons within the cumin MOAH fraction. Image Credit: LECO Corporation
The analysis also detected an additional group of substances — certain biogenic sesquiterpenes often present in the cumin. Figure 5 illustrates both the position of this class of substances in the contour plot, which overlaps partially with the monoaromatic fraction and the detection of one of the components identified (γ-amorphene, 850/1000), as an example.
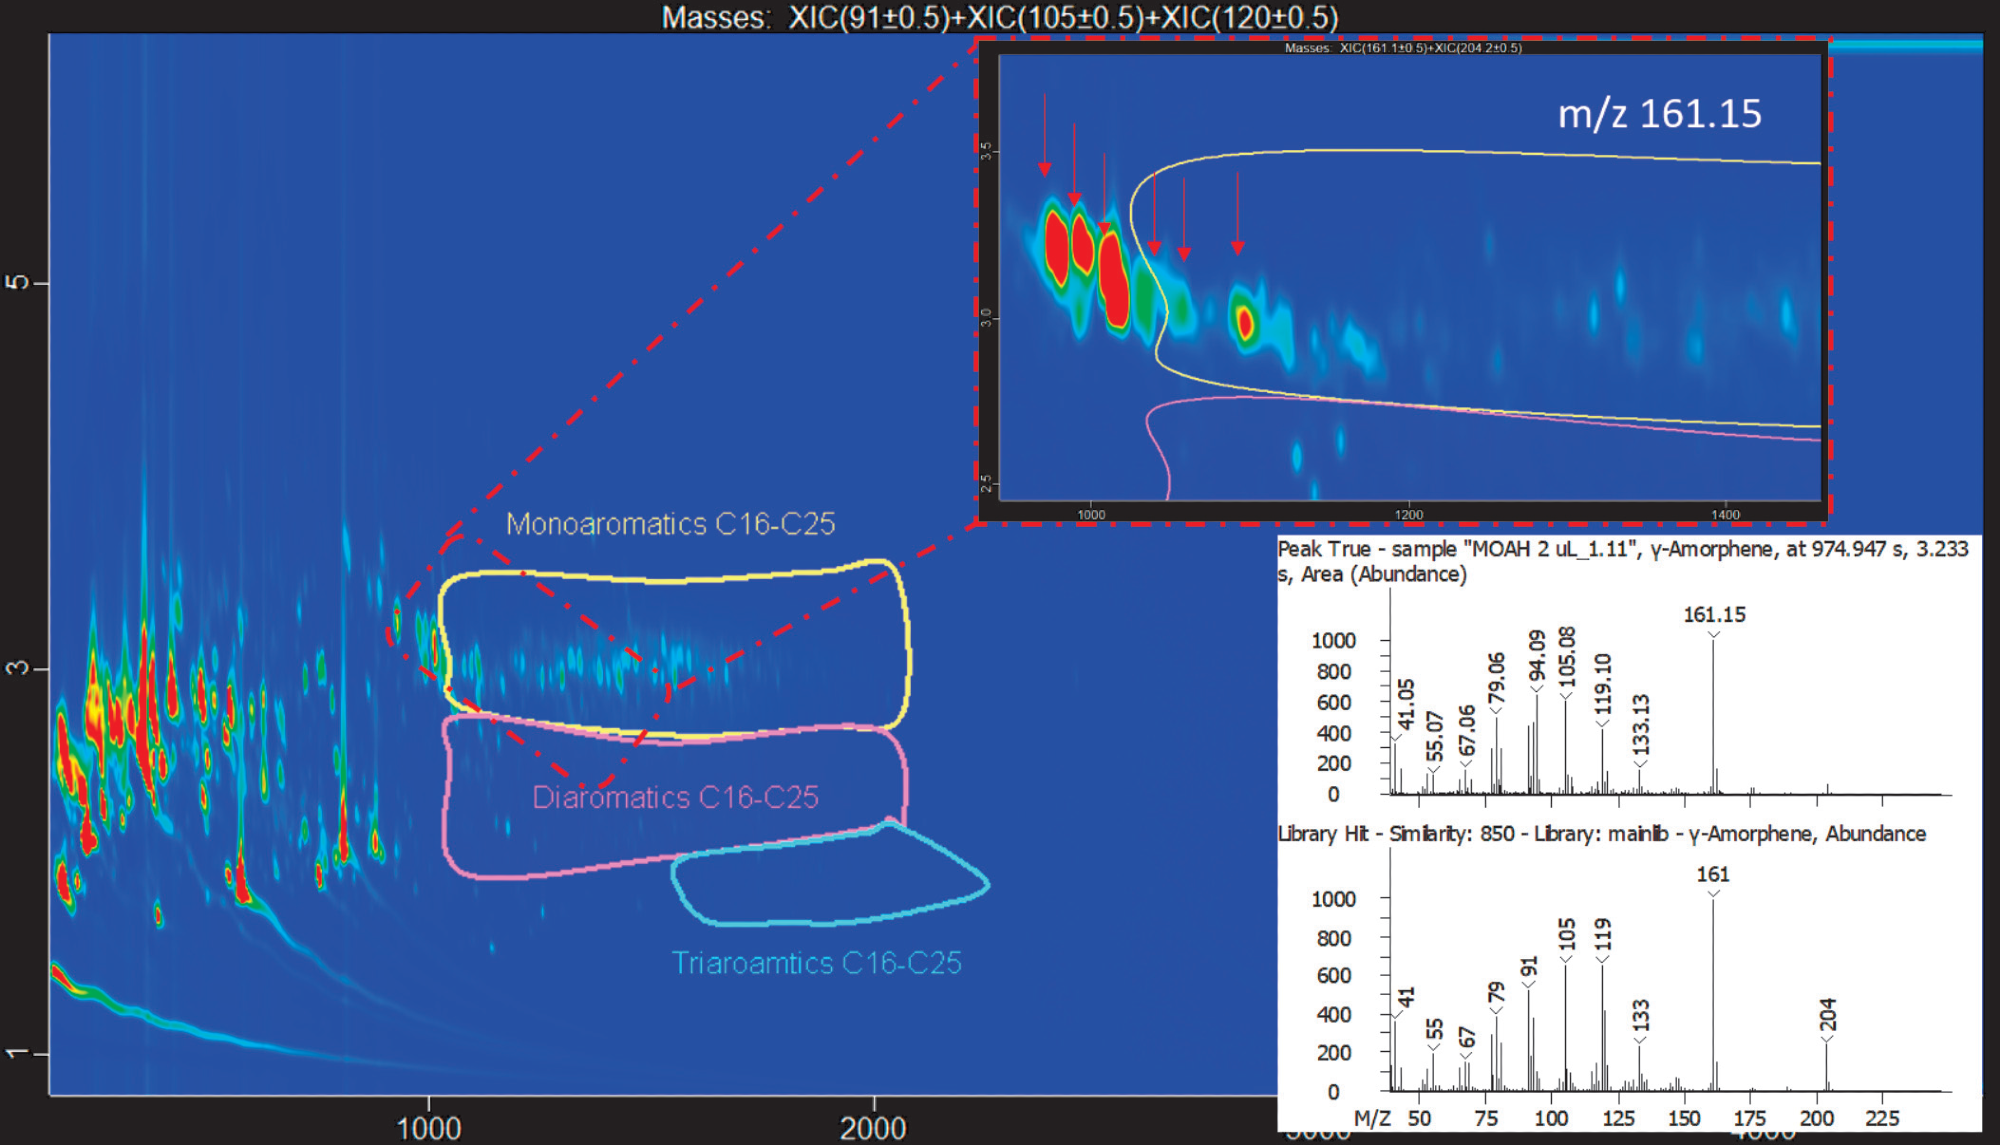
Figure 5. The red circled zone comprises some naturally occurring sesquiterpenes, such as the positively identified γ-amorphene. Image Credit: LECO Corporation
This data is just an instance of how the GCxGC technology, together with the power of LECO’s TOFMS, can enhance the confidence of users when MOSH/MOAH samples are quantified and qualified.
Conclusions
This article shows that LECO’s GCxGC-TOFMS technology is a seamless option to detect the occurrence of MOSH/MOAH contaminants in food samples. A confirmatory GCxGC-TOFMS analysis has been carried out on the cumin extract as recommended by the EFSA.
The occurrence of a MOSH/MOAH contamination was thus confirmed, together with the presence of natural biogenic substances that do not belong to these fractions and probably bias the quantitative results achieved using the traditional methods.
Existing activities involve the use of an extensive range of difficult matrices and the use of FID for quantification. Moreover, based on the technique discussed here, these are being performed and validated together with further development and finalization of a fit for a purpose software tool for an ideal and complete MOSH/MOAH analysis workflow.
References
- Scientific Opinion on Mineral Oil Hydrocarbons in Food (EFSA). EFSA Journal 2012;10(6):2704. 10.2903/j.efsa.2012.2704
- EFSA Technical Report. Rapid risk assessment on the possible risk for public health due to the contamination of infant formula and follow on formula by mineral oil aromatic hydrocarbons (MOAH). https://doi.org/10.2903/sp.efsa.2019.EN-1741

This information has been sourced, reviewed and adapted from materials provided by LECO Corporation.
For more information on this source, please visit LECO Corporation.