The appraisal of precious stones typically involves an array of instruments, including various general gemstone appraisal tools such as the stereoscopic microscope and more specialized analytical instruments.1
These analytical instruments include the Fourier transform infrared spectrophotometer (FT-IR) – a device generally used to confirm the application of heat treatment or resin impregnated treatment - and the UV-Vis spectrophotometer (UV-Vis) – a device used to determine the presence or absence of coloring treatment.
An energy dispersive X-ray fluorescence spectroscope (EDXRF) also represents a vital, indispensable instrument offering rapid, non-destructive composition analysis; for example, EDXRF is able to definitively detect the lead used in the lead glass-filling treatment of gemstones.
The article summarizes the use of a Shimadzu EDX-8100 in the composition analysis of rubies, emeralds and Paraiba tourmalines – popular, commonly encountered and commercially available gemstones.
Investigations were conducted into the instrument’s ability to distinguish between natural and synthetic stones and its ability to identify the geographic origin of any natural stones present in the study.
Samples
A variety of natural and synthetic precious stones and rough gemstones were used. These are outlined in the table below.
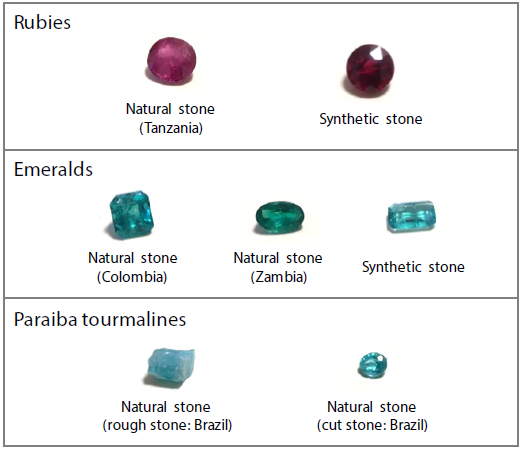
Figure 1. Types and Origins of Precious Stones and Gemstones. Image Credit: Shimadzu Scientific Instruments
Elements
The following elements were used: 11Na - 92U
Sample Preparation
Samples were set appropriately to enable direct X-ray irradiation before being measured.
Ruby: Measurement Results and Notable Differences
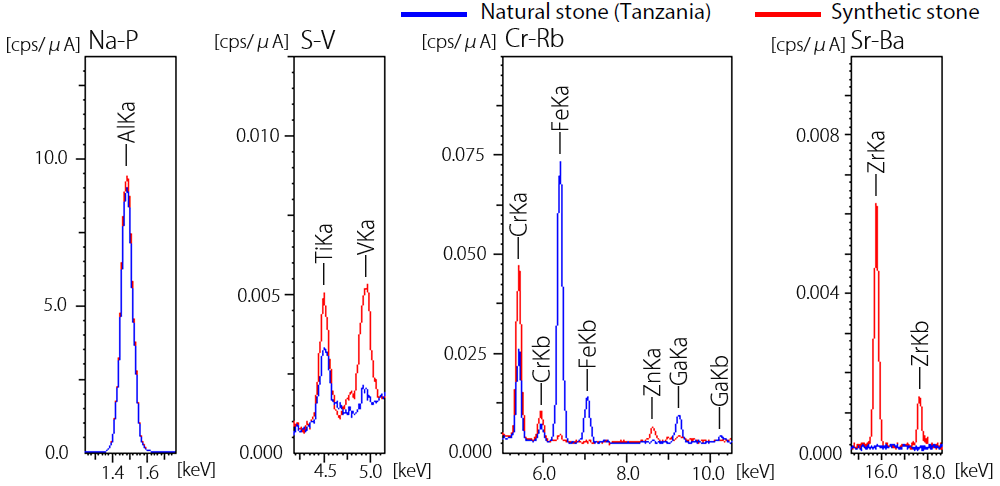
Figure 2 displays both qualitative and quantitative analysis results for Tanzanian natural stone and synthetic stone.
In the example presented here, it was impossible to detect a trace amount of gallium in the synthetic stone. The natural stone (Tanzania) also presented a lower chromium content than the synthetic stone.
This highlights the potential for natural stones and synthetic stones to be distinguished by these differences, but it should be noted that in some instances, elements originating from a catalyst may also be detected in synthetic stones.
| |
|
|
[wt%] |
| Element |
Composition |
Natural stone (Tanzania) |
Synthetic stone |
| Aluminum |
Al2O3 |
99.395 |
99.439 |
| Titanium |
TiO2 |
0.018 |
0.025 |
| Vanadium |
V2O5 |
0.003 |
0.017 |
| Chromium |
Cr2O3 |
0.255 |
0.477 |
| Iron |
Fe2O3 |
0.324 |
0.009 |
| Gallium |
Ga2O3 |
0.005 |
— |
| Zirconium |
ZrO2 |
— |
0.035 |
Figure 2. Results of Qualitative Analysis/Quantitative Analysis of Rubies. Image Credit: Shimadzu Scientific Instruments
Emerald: Measurement Results and Notable Differences
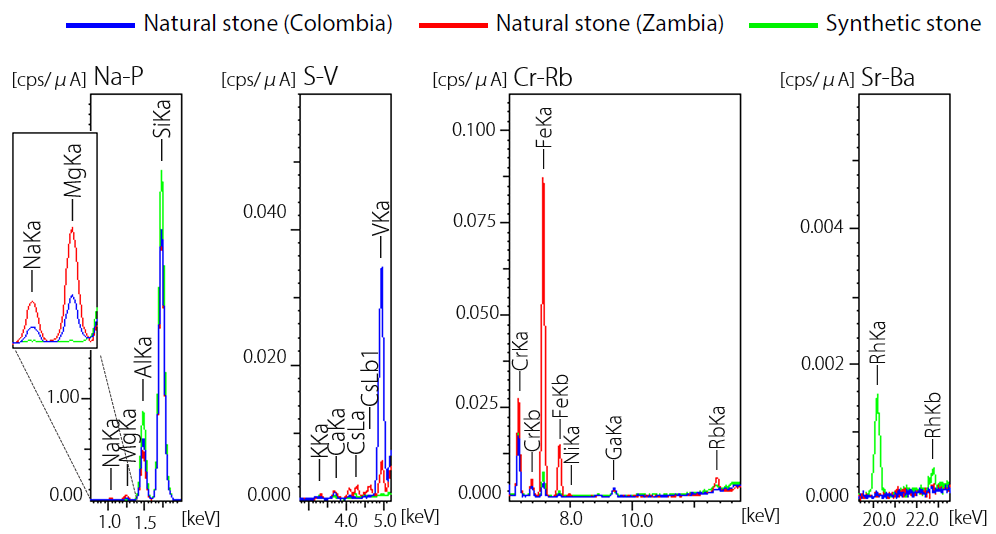
Figure 3 displays both qualitative analysis and quantitative analysis results for two types of Columbian and Zambian natural stones, as well as synthetic stone.
Emeralds’ color stems from the presence of chromium, iron and vanadium, with stones’ hues changing depending on the amounts of these elements present.
In the example presented in Figure 3, results from the Zambian stone confirm high contents of chromium and iron and low content of vanadium versus the Colombian stone.
Comparatively large amounts of magnesium, sodium and potassium were also detected in the Zambian stone, as well as trace amounts of rubidium and cesium. These differences are a key indicator in terms of distinguishing this stone from the Colombian stone.
The price of emeralds is typically determined by their transparency, hue and depth of color (color strength), but their geographic place of origin is also a key factor in their economic value.
Emeralds tend to display distinctive features based on their respective geographic origin; for example, Colombian stones exhibit a bright green color, while Zambian stones are characterized by high transparency. Colombian stones are generally more expensive.
Distinguishing deep green Zambian emeralds from Colombian emeralds can be challenging and typically require the use of elemental analysis to determine the stones’ geographic origin confidently.
In the example presented here, the synthetic stone was identified by detecting the presence of rhodium - likely originating from a catalyst - and the lack of sodium and magnesium in the detection results.
| |
|
|
|
[wt%] |
| Element |
Composition |
Natural stone (Colombia) |
Natural stone (Zambia) |
Synthetic stone |
| Sodium |
Na2O |
0.879 |
2.335 |
— |
| Magnesium |
MgO |
0.954 |
2.518 |
— |
| Aluminum |
Al2O3 |
18.033 |
15.028 |
21.252 |
| Silicon |
SiO2 |
79.021 |
77.925 |
78.098 |
| Potassium |
K2O |
— |
0.031 |
— |
| Calcium |
CaO |
0.031 |
0.037 |
— |
| Vanadium |
V2O5 |
0.518 |
0.069 |
— |
| Chromium |
Cr2O3 |
0.506 |
0.829 |
0.560 |
| Iron |
Fe2O3 |
0.051 |
1.136 |
0.075 |
| Gallium |
Ga2O3 |
0.006 |
0.005 |
0.003 |
| Rubidium |
Rb2O |
— |
0.002 |
— |
| Cesium |
Cs2O |
— |
0.084 |
— |
| Rhodium |
Rh2O3 |
— |
— |
0.012 |
Figure 3. Results of Qualitative Analysis/Quantitative Analysis of Emeralds. Image Credit: Shimadzu Scientific Instruments
Paraiba Tourmaline: Measurement Results and Notable Differences
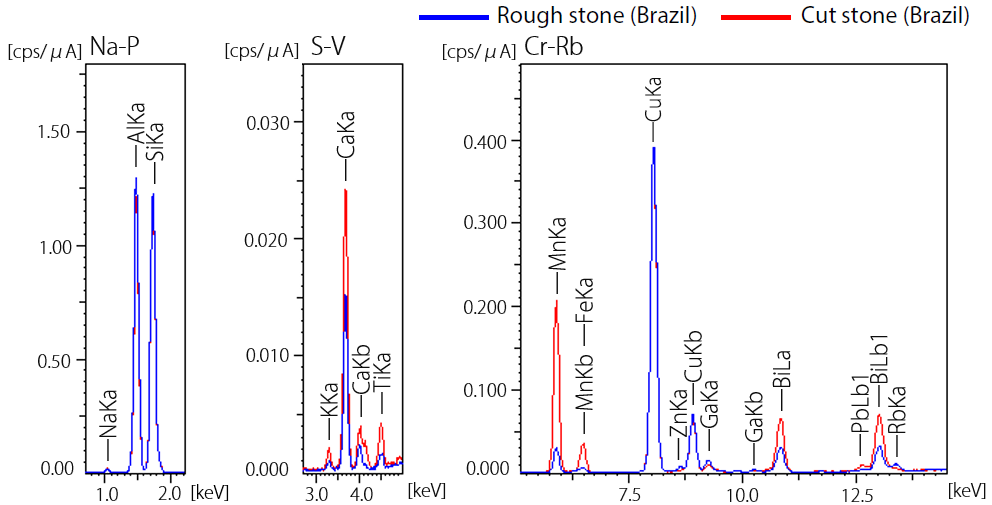
Figure 4 displays both qualitative and quantitative analysis results for the rough gemstone and the cut stone – both of these were produced in Brazil.
Results presented in Figure 4 confirm that the stones’ primary components are oxides of aluminum and silicon. The samples were also found to contain manganese and copper. These discoveries combined were sufficient to conclude that both samples were natural Paraiba tourmaline.
Paraiba tourmaline is produced in three areas (Brazil, Nigeria and Mozambique). The stones investigated here were concluded to be likely of Brazilian origin due to their copper contents exceeding 0.6 w% (CuO). Further detailed analysis was also performed using LA-ICP-MS.2
The results also showed that the cut stone included a high manganese content of 4 wt% (MnO) in contrast to the 0.5 wt% (MnO) content of the rough stone.
Stones typically exhibit a strong green hue where Mn content is high, but the hues of both stones appeared to be an identical neon blue when viewed with the naked eye (Figure 5).
To differentiate the samples, they were observed using an OLS5000 3D measuring laser microscope (Figure 6). Green areas were noted in the stones’ interior and are believed to be an influential factor in the high content of Mn.
Table 1. Measurement Conditions. Source: Shimadzu Scientific Instruments
| . |
. |
| Instrument |
EDX-8100 (EDX-8000) |
| Elements |
Na - U |
| Analysis group |
Qualitative analysis and quantitative analysis |
| Detector |
SDD |
| X-ray tube |
Rh target |
| Tube voltage |
15 [kV] (Na-V), 50 [kV] (Cr-U) |
| Tube current |
Auto [μA] |
| Collimator |
3 [mm φ] |
| Primary filter, channel |
Non [Na-P], #1 [Sr-Ba], #2 [S-V], #4 [Cr-Rb] |
| Atmosphere |
Vacuum |
| Integral time |
50 [s] × 4 Ch |
| Dead time |
Maximum 30 [%] |
| |
|
|
[wt%] |
| Element |
Composition |
Rough stone (Brazil) |
Cut stone (Brazil) |
| Sodium |
Na2O |
2.235 |
2.894 |
| Aluminum |
Al2O3 |
45.291 |
42.494 |
| Silicon |
SiO2 |
49.379 |
47.285 |
| Potassium |
K2O |
0.040 |
0.092 |
| Calcium |
CaO |
0.516 |
0.822 |
| Titanium |
TiO2 |
0.027 |
0.074 |
| Manganese |
MnO |
0.561 |
4.021 |
| Iron |
Fe2O3 |
0.032 |
— |
| Copper |
CuO |
1.767 |
2.054 |
| Zinc |
ZnO |
0.017 |
— |
| Gallium |
Ga2O3 |
0.043 |
0.027 |
| Rubidium |
Rb2O |
0.006 |
— |
| Lead |
PbO |
— |
0.021 |
| Bismuth |
Bi2O3 |
0.087 |
0.217 |
Figure 4. Results of Qualitative Analysis/Quantitative Analysis of Paraiba Tourmaline. Image Credit: Shimadzu Scientific Instruments
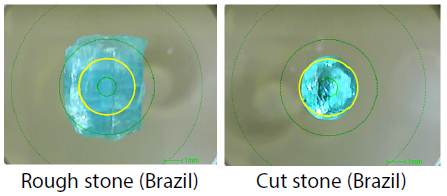
Figure 5. Observation Images of EDX Samples ( : X-Ray Irradiation Range 3 mm φ). Image Credit: Shimadzu Scientific Instruments
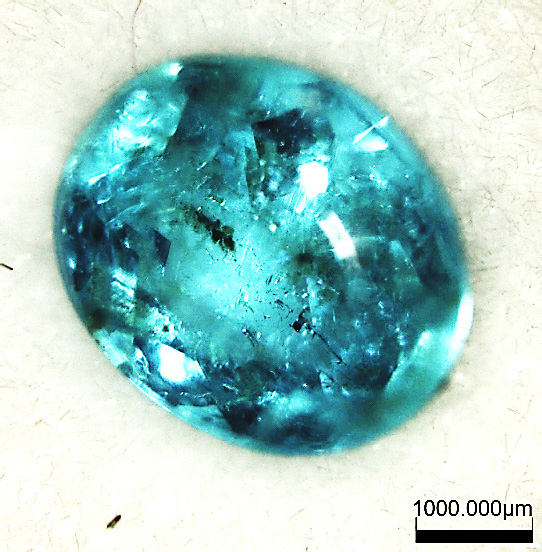
Figure 6. Observation Image of Cut Stone (OLS5000). Image Credit: Shimadzu Scientific Instruments
Conclusion
The results presented throughout this article highlight the potential for the differentiation of natural stone and synthetic stone – and the determination of the geographic origin of natural stones – to be estimated by evaluating the types of elements present, the differences in their contents and any further trace detection.
A comparison was made between measurements acquired using only EDX and appraisals of gemstones using EDX measurement in combination with other analytical instruments (FT-IR, UV-Vis).
This comparison confirmed that use of EDX with other instruments resulted in improved accuracy.3
References
- Dr. Ahmadjan Abduriyim: The Science of Gemstones, ARK PUBLISHING INC.
- Ahmadjan Abduriyim, Hiroshi Kitawaki, Masashi Furuya, and Dietmar Schwarz: “Paraiba”-Type Copper Bearing Tourmaline from Brazil, Nigeria, and Mozambique: Chemical Fingerprinting by LA-ICP-MS
- Ahmadjan Abduriyim and Hiroshi Kitawaki: Applications of Laser Ablation-Inductively Coupled Plasma Mass Spectrometry (LA- ICP-MS) to Gemology
Acknowledgments
Produced from materials originally authored by T. Nakao and H. Nakamura from Shimadzu Scientific Instruments Inc.
The authors on which this piece is based wish to express their deep appreciation to Dr. Ahmadjan Abduriyim, who is the Representative of Tokyo Gem Science LLC and Director of the GSTV Gemological Laboratory, for various advice in connection with gemology and gemstone appraisal.

This information has been sourced, reviewed and adapted from materials provided by Shimadzu Scientific Instruments.
For more information on this source, please visit Shimadzu Scientific Instruments.