Many applications require steel to be shaped and curved, highlighting the importance of maintaining a sufficient level of ductility to enable bending without allowing cracks. These applications typically employ a specific type of steel alloy – high-strength, low-alloy (HSLA) steel.
HSLA steels feature a lower carbon content and reduced amounts of chromium, nickel, and molybdenum than other alloy steels like AISI 4140. This decrease in carbon enables higher weldability and formability.
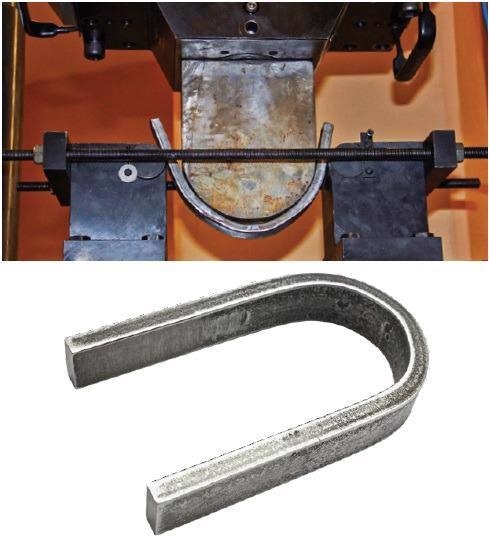
Figure 1. Bend test (top) and tested piece (bottom). Image Credit: Thermo Fisher Scientific – Electron Microscopy Solutions
HSLA steel is evaluated with a bending test prior to being manufactured in its final shape, ensuring no risk of cracks or fractures during or after bending.
When failures do occur, it is vital that the underlying cause be investigated and understood.
Frequently encountered types of cracking include hydrogen cracks (typically found in weld heat affected zones), hot tears (caused by contamination by tin or copper during solidification) and subsurface non-metallic inclusions (from native or endogenous steelmaking inclusions or from exogenous or foreign inclusions like refractory or slag).
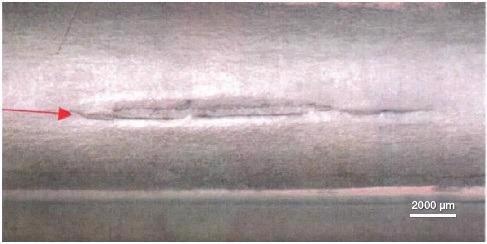
Figure 2. Image of a failed bend test. Image Credit: Thermo Fisher Scientific – Electron Microscopy Solutions
Steel production relies on the deoxidation process to reduce the dissolved oxygen content to an acceptably low level. Aluminum is typically utilized in this process, producing micron-sized, high melting-point aluminum oxide particles.
There is a risk of pure aluminum oxide inclusions becoming contaminated with magnesia, calcia or slag droplets during refining and casting.
Figure 3 displays the Ca-Al-Mg ternary diagram of oxide inclusions analyzed in the steel close to the bend test defect. This analysis was performed using a Thermo Scientific™ Phenom™ ParticleX Steel Desktop SEM, allowing thresholding of features greater than 1 µm.
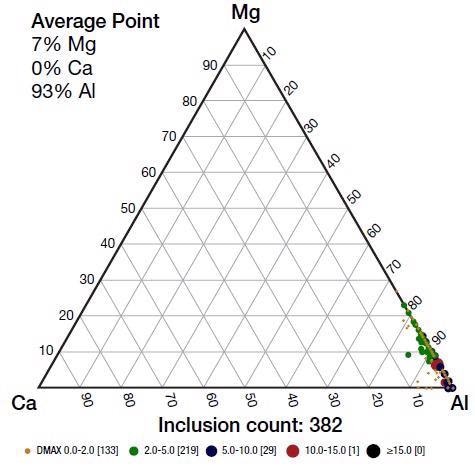
Figure 3. Base inclusion analysis was collected on this sample by the Phenom ParticleX Steel Desktop SEM. Image Credit: Thermo Fisher Scientific – Electron Microscopy Solutions
Reoxidation may occur where slag, refractory or air contributes oxygen to steel just before solidified in the mold. This commonly occurs during the molten metal transfer from ladle to tundish or from tundish to mold.
This reoxidation may result in inclusions agglomerating and becoming trapped in the cast product. Hot rolling can prompt these large agglomerated inclusions to break apart, deforming them into stringers or slivers, which are then spread out along the rolling direction.
Materials and Methods
This article explores the characterization of a bend test failure using a Thermo Scientific™ Axia™ ChemiSEM.
The Axia ChemiSEM exposed the underlying cause of the failure, exhibiting a short time-to-result and a comprehensive range of information.
In the example presented here, the sample of interest is HSLA hot-rolled steel that had failed during a bend test. An Axia ChemiSEM was used to observe several cross sections of the fractured sample (Figure 4).
Results and Discussion
The area of interest was imaged, and quantitative elemental information was acquired for the investigated features at 15 kV. A moderately low beam current (0.22 nA) was employed to minimize beam spreading and maximize spatial resolution.
Figure 5 displays a lower magnification overview of the crack – which is also evident in the optical image shown in Figure 4.
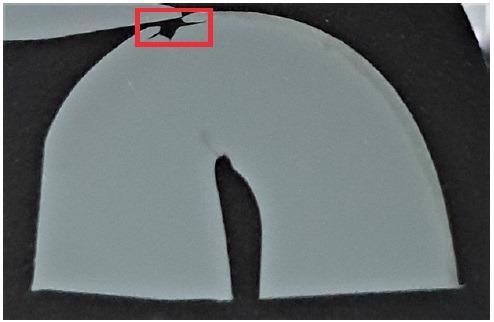
Figure 4. Cross section of a bend tested steel. The crack, propagated on the outer radius, is highlighted in red. Image Credit: Thermo Fisher Scientific – Electron Microscopy Solutions
The split on the outer radius was found to open to a depth of approximately 400 microns. An inclusion stringer can be observed (Figure 5, in red) at the base of the split. This extends into the metal at an identical depth.
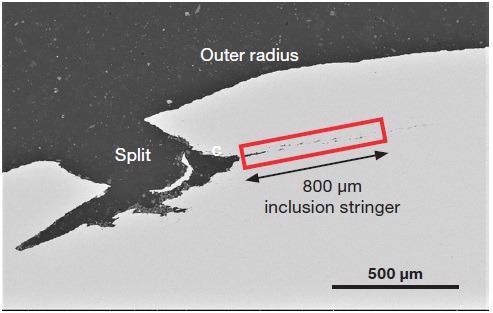
Figure 5. Backscattered electron image of the split. The highlighted area is the inclusion stringer that started at the base of the split (Acc voltage 15 keV, beam current 0.22 nA). Image Credit: Thermo Fisher Scientific – Electron Microscopy Solutions
Additional higher magnification images and ChemiSEM maps were acquired to further investigate the inclusions within the stringer.
Figure 6 displays several inclusions found in the stringer – the top image displays the secondary electron signal, providing topographical information and highlighting the presence of voids.
When inclusions are present, voids are typically formed during the hot rolling process due to the deformed steel surrounding the foreign particles experiencing significant tensile stress along the rolling direction.
The bottom image displays the backscattered electron signal, providing compositional information based on the imaged material’s atomic number. This image does not provide sufficient information to clarify the nature of the inclusions, however.
The traditional approach to this analysis would see the operator switch to a different software package, run conventional EDS mapping and, subsequently, spend more time post-processing of the EDS raw data to generate useful quantitative information.
However, the Axia ChemiSEM provides immediate access to quantitative elemental information because the EDS signal is collected during SEM image acquisition (Figure 6), meaning vital compositional information is simply a click away.
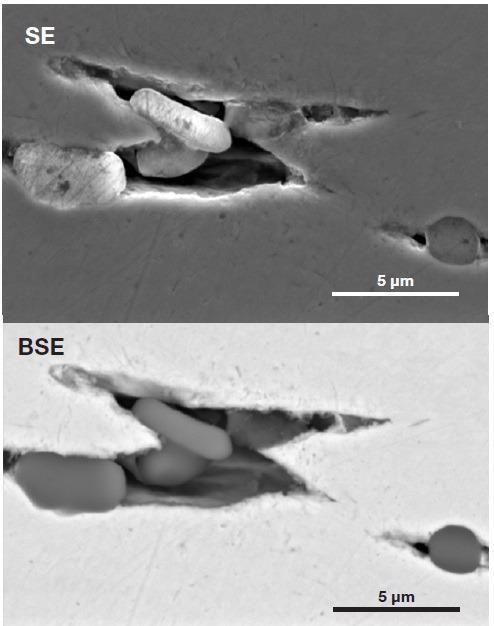
Figure 6. Higher magnification view of the inclusions in the stringer (Acc voltage 15 keV, beam current 0.22 nA, acquisition time 60 s). Image Credit: Thermo Fisher Scientific – Electron Microscopy Solutions
Once the backscattered electron image has been acquired, the operator can then select an appropriate visualization to show the previously acquired elemental information.
In the study presented here, elements have been selectively activated to highlight their distribution within the inclusions. There is no overlap in the coloring.
Figure 7 confirms the presence of non-metallic inclusions, with the left group indicating a majority of aluminum and the right inclusion indicating the presence of magnesium.
A series of 30-second area analyses were performed on the different types of inclusions, focusing on the areas highlighted in Figure 7. Table 1 presents the quantifications acquired from these two areas.
Table 1. Quantifications obtained from areas 1 and 2 presented in Figure 7 (Analyses condition: acc voltage 15 keV, beam current 0.22 nA, acquisition time 30 s). Source: Thermo Fisher Scientific – Electron Microscopy Solutions
| Element |
AREA 1
Atomic % |
AREA 2
Atomic % |
| O |
61.3 |
59.4 |
| Mg |
— |
8.4 |
| Al |
38.7 |
32.2 |
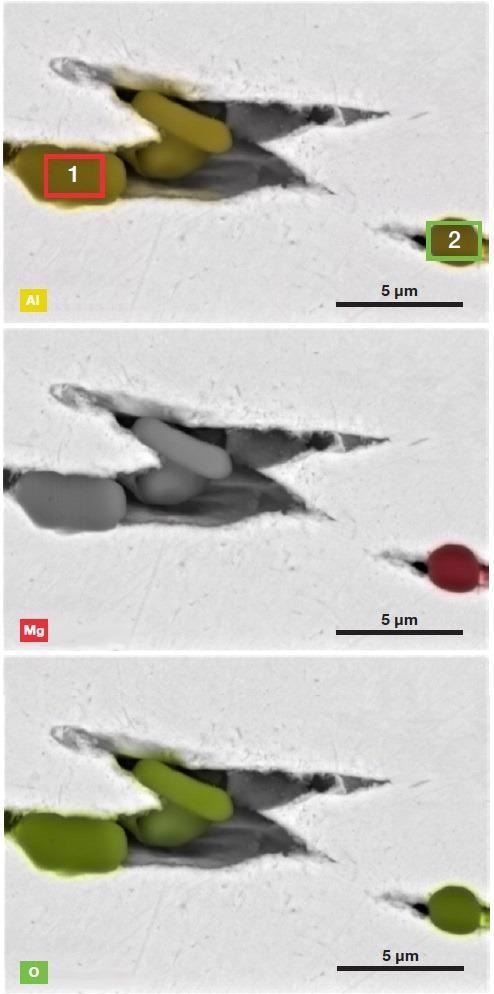
Figure 7. ChemiSEM images (showing Al, Mg, and O distribution, respectively) of the ROI in Figure 6 (Acc voltage 15 keV, beam current 0.22 nA, acquisition time 60 s). Image Credit: Thermo Fisher Scientific – Electron Microscopy Solutions
Both the quantification and the ratio between elements indicate that the inclusions in the left section of Figure 7 (including Area 1) are comprised of alumina, while the right inclusion is an Mg-Al oxide.
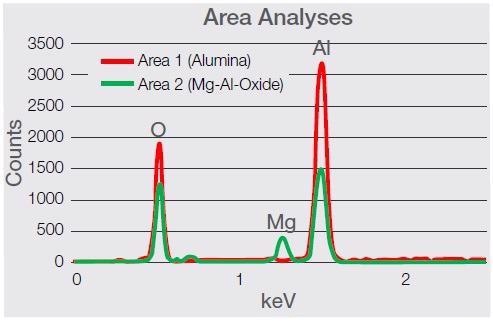
Figure 8. Spectra comparison between the two types of inclusion, showing a clear presence of magnesium (Kα at 1.253 keV). Image Credit: Thermo Fisher Scientific – Electron Microscopy Solutions
Conclusions
Bend testing is an essential quality control measure for steel and a range of other materials. This process is vital in confirming ductility and resistance to fracture.
In instances where the material of interest has suffered fractures or cracks, it can be reasonably assumed that this will fail again if employed in similar applications. Understanding the cause of failure is, therefore, key to its future prevention.
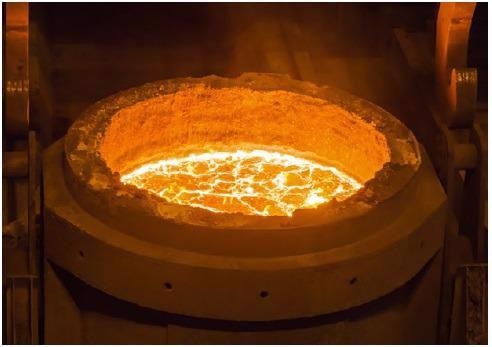
Steel refining is performed in a ladle where deoxidation, desulfurization and inclusion flotation may occur. Image Credit: Thermo Fisher Scientific – Electron Microscopy Solutions
This article presented a rapid, efficient approach to determining the underlying cause of a failed bend test on a specific high-strength steel.
With the novel workflow and approach afforded by the new ChemiSEM Technology, the morphological characterization of an area of interest is no longer separated from compositional information.
An imaging session will simultaneously generate SEM images and quantitative elemental data – the latter being acquired in the background during grayscale image acquisition. These are then displayed to facilitate an improved understanding of the elemental distribution.
In the example presented here, native steelmaking inclusions were located as a stringer under the steel’s surface. The hot rolling process had spread out a cluster of non-metallic inclusions into a linear defect, ultimately causing the bend test to fail.

This information has been sourced, reviewed and adapted from materials provided by Thermo Fisher Scientific – Electron Microscopy Solutions.
For more information on this source, please visit Thermo Fisher Scientific – Electron Microscopy Solutions.