From manufacturing to recycling, industries can benefit a lot from the use of polymer analysis by XRF.
A recent interview with Christopher Shaffer, XRF, XRD, and OES Business Development Manager, from Thermo Fisher Scientific, outlines the uses and benefits of this powerful technique throughout the entire polymer value chain, looking at where XRF fits into these processes and providing a number of example scenarios and applications of this.
Could you give a brief introduction to XRF and the underlying principles of this technique?
XRF is an inorganic elemental analysis technique used on solids, liquids and powders. In XRF, we use an x-ray source to eject an inner electron from an atomic shell, leaving this in a very unstable state.
To become more stable, this outer shell electron will relax, release energy and take the place of that missing electron. This process emits energy known as fluorescence energy, which is what we measure via XRF.
This released energy is unique to an element, so we can use different techniques to quantify and identify that fluorescence energy.
There are two styles of x-ray fluorescence: energy dispersive and wavelength dispersive.
Energy dispersive XRF is a more direct analysis of the fluorescence energy emitted from the sample. We use an x-ray source, an excited sample and a solid-state detector to collect the fluorescence energy. The detector is used for the discrimination and determination of this collected energy.
In wavelength dispersive XRF, we use a combination of crystals and detectors to determine what the collected energy is. This system is known as a goniometer.
Wavelength dispersive XRF takes fluorescence energy and uses a crystal to diffract and divide this into its component wavelengths. Using the detector and the crystal, a 2 theta angle can be determined for that individual element.

How does XRF compare to other techniques in terms of its accuracy and limits of detection?
When we compare X-ray fluorescence to other techniques such as ICP or spark emission, we can see that X-ray fluorescence can accommodate single-digit PPM, all the way up to 100% analysis on many different types of elements.
XRF reaches the detection limits of an ICP, which can be as low as PPP, PPT or even PPQ, but with XRF, there is a lot less sample preparation required. We can typically run a sample, as received, with minimal or no sample preparation, whereas in ICP, we must dissolve the sample into an aqueous solution. Dissolving a sample in this way will lead to different degrees of dilution, potentially impacting ICP’s detection limits.
XRF can be used with solids or liquids, but not gases.
How are samples prepared for XRF, and what factors should users bear in mind when looking to work with this technique?
Sample preparation is critical for X-ray analysis. There are many different approaches to sample preparation, depending on the sample we are running.
For liquids, we use disposable films with different films as support. The films we use are determined by what type of solution we are using.
The best way to measure materials depends on what type of solution is being used. For example, gravimetric or volumetric measuring techniques work very well if we have an aqueous solution. If you have a nonaqueous solution - like an oil solution - then gravimetric measuring is the method to use.
We tend to use the same support, films and disposable cells as we do in liquids for loose powders. We simply insert an amount of sample into a cell gravimetrically when working with this sample type.
Regardless of the loose powder sample type, we tend to use the least absorbing film. This is typically polypropylene.
The advantages of this approach are that it is a quick, inexpensive means of conducting heavy metal analysis. The disadvantages of this method lie in its inability to offer an adequate analysis of light elements, primarily due to the film’s absorption rate. There are also issues with inconsistent packing on the sample’s surface, prompting differences in detection between particles and creating variation.
When preparing polymers, we tend to use a hot press to heat the polymer and press this under about 10 tons of pressure. This method is ideal for good sample preparation, offering good surface adherence and surface smoothness. It also doesn’t require a film and is suitable for elements ranging from carbon to uranium.
The downside to this method of polymer preparation is that this is a more expensive technique requiring a specific hot press to be available in the lab. These presses can only reach 180 °C, and while the process does not need a melt temperature, this does need to sufficiently soften the polymer for pressing this into a solid disc.
What are some of the specific advantages of XRF? Why might users want to implement an XRF setup in their labs?
One of the most significant advantages of XRF is its ability to analyze numerous types of samples. XRF is not restricted to just aqueous samples; it can accommodate solid solutions or suspensions.
The majority of sample preparation with XRF is fast and relatively simple compared to other techniques because we can measure many samples directly. Most techniques also require linear calibrations, but if we are using XRF without standards, we can use semi-quantum fundamental parameters to achieve quick analysis for single or multiple element procedures.
Where can XRF be implemented in the polymer value chain? Are there any particularly representative examples of this?
XRF fits into the polymer value chain at almost every step of the process; everything from exploration, refining and processing, through to polymer production, final product manufacture and finally during the recycling of a product back into either a polymer chain.
XRF is also useful when looking to meet environmental regulations in terms of analyzing the polymer as a waste.
In exploration, we can use XRF for mineral identification and quantification, for example, in blast holes and pouring samples. We can analyze the elements present from PPM to 100% levels, either to look for trace elements that identify the presence or likelihood of oil-rich ores or to just look at the sample’s general composition and its major and minor components.
In a typical exploration application, we would take a sample, run the XRF analysis and determine its elemental composition. This would typically be expressed as oxides – a stoichiometric expression of elemental concentrations.
We take that information and use another technique known as X-ray diffraction (XRD) to determine the phase assembly or any crystalline components in the sample.
When we perform a search on a database for XRD, there will be hundreds of thousands of possible candidates populating our search results. We can use our XRF results to minimize the search criteria by knowing which elements to search for. This aids in the processing and quantification of the XRD data.
The combination of these two techniques allows us to gain a complete picture of the elemental composition and the mineralogy of the samples we are looking at.
What other application areas in the petrochemical industry does XRF see regular use within?
XRF applications vary dramatically in the petrochemical industry. These include everything from environmental regulation, software determination, refinement, analysis of diesel and gasoline, corrosion prevention, process optimization, QA/QC and a full range of other laboratory uses.
Types of samples can range from gasoline to catalysts, additives and everything in between. We often use different ISOs, norms or regulations that dictate which elements we are going to look for and the concentration ranges we need to achieve. Using this information, we can better determine which X-ray will best fit our analysis needs.
For example, when looking at crude oil, we typically monitor sulfur, chloride and other contaminants in the crude oil. Sulfur determination, in particular, can involve very high concentrations, depending on where the crude oil comes from - from thousands of PPM up to 5% or 6% in value.
XRF can easily accommodate these limits using a long-range, linear regression. This can be achieved with just one calibration, with no need to dilute.
Chloride determination is key to managing corrosion and emission issues in the refinery. We need to monitor this and ensure that chloride concentrations are low enough so that we don’t start corroding the refinery pipes or ore.
When working with other heavy metals, such as vanadium and nickel, we need to determine and quantify these because they can poison the catalyst and render this ineffective in the cracking process.
If these metals move through the refinement process and enter oil products, this can create corrosion issues in the engine blocks. Again, XRF is excellent at detecting all of these substances from low PPM to high percentage ranges.

Image Credit:Shutterstock/oilandgasphotogragher
What factors should users consider when using XRF for trace element analysis?
Sulfur is the most common target in trace element analysis. Acceptable limits of sulfur are set in regulations, country by country.
For example, in gasoline, the regulations state that sulfur levels must be 10 PPM or less, while in diesel, this is 15 PPM or less. These regulations continue to be set lower and lower, so we need to be able to measure as low as possible to adhere to these regulations.
Using energy-dispersive XRF, we can reach a detection limit of two PPM of sulfur, while using wavelength dispersive allows us to reach as low as 0.1 PPM - well within even the lowest regulations on either technique.
The other thing we have to consider is repeatability as this determines how reliable our results are. In one example application, we ran the same solution in 20 different cells, measuring an average concentration of 7.3% and a typical variation of less than 0.3 PPM.
This example confirmed very high precision from sample to sample, even using different cells. In fact, the cells were typically where we saw most of the variation.
What is XRF’s role in quality control and contaminant analysis?
We can use XRF for quality control as part of oil analysis. There are many different areas where we can do this, such as avoiding wasting fuel or looking for hazardous materials. Oil may be contaminated by anything from wear metals to other environmental contaminants during routine use.
Chrome and nickel are some of the more common wear metals. Their presence in oil can indicate where a part is wearing, how fast it is wearing and where failures could potentially come from.
Contaminants like sulfur and fluoride generally come from environmental conditions. These need to be monitored to help minimize external contaminants in the oil.
Are there any other areas where XRF analysis is used?
There are a few more key areas where we can use XRF in the polymer field. For example, lubricating additives are intentionally added inorganic elements designed to enhance the effectiveness of different lubricants. These must be maintained and monitored via a QA/QC process because out-of-specification additives will result in out-of-specification oil materials.
Another essential part of the refinement process is the cracking catalyst – the catalyst used to break down the crude oil into its component hydrocarbons.
One of the main elements we need to monitor in this instance is the total chloride. This should be done in fresh regenerator spent alumina catalyst because the effectiveness of the catalyst may be affected if chlorine levels are too high.
We can also use XRF to evaluate suppliers, undertake R&D on new catalyst formulations, audit controls and evaluate recycling of the bulk catalyst. The best method for preparing these samples is via what is known as fusion - the addition of lithium tetraborate and metaborate mixtures and fusing this into a solid glass disc. This then creates homogenous samples which offer long dynamic ranges.
Using fusion, we can calibrate different elements from a PPM level up to 100%. This is all done using the same linear regressions, making it very easy to do QA/QC control over a multitude of elements for the catalyst.
Working with polymers and plastics involves more products designed for the end-user, with less focus on refinement and more on plasticizers.
The analysis of polymer additives is another key focus in this area. These additives are inorganic elements added to polymers to give them different properties, such as stabilizers, flame retardants, antioxidants or colorants.
Some polymers also develop undesirable properties as they break down. When organometallics break down, for example, polymers will degrade and start releasing certain elements that are very toxic or environmentally damaging.
We can use XRF to monitor both these aspects - polymer additions and the breakdown of the polymer with respect to the environmental regulations.
When working with polymers, typical elements we can investigate via XRF include magnesium, calcium, iron, zinc, and more. These elements can be easily analyzed by EDXRF or WDXRF, with the best choice of technique depending on which elements are in the concentration range.
What sort of calibration steps are required when using XRF for polymer analysis?
We typically will do a matrix match calibration. This is where we take a calibration standard from a similar type of polymer with known concentrations, create linear regressions and then run our unknown sample against this.
If we don’t have an exact matrix match, as long as we can get a liquid with the same density, we can often use those liquids to create different calibrations of our actual polymer samples.
In XRF, we only need to calibrate the system once, and we can maintain these calibrations for the instrument’s life using something known as drift correction.
Drift correction uses samples that do not change over time. They are used to monitor the degradation of an X-ray tube or any other components and then factor in that change to ensure the calibration is relevant through the entire lifespan of the instrument.
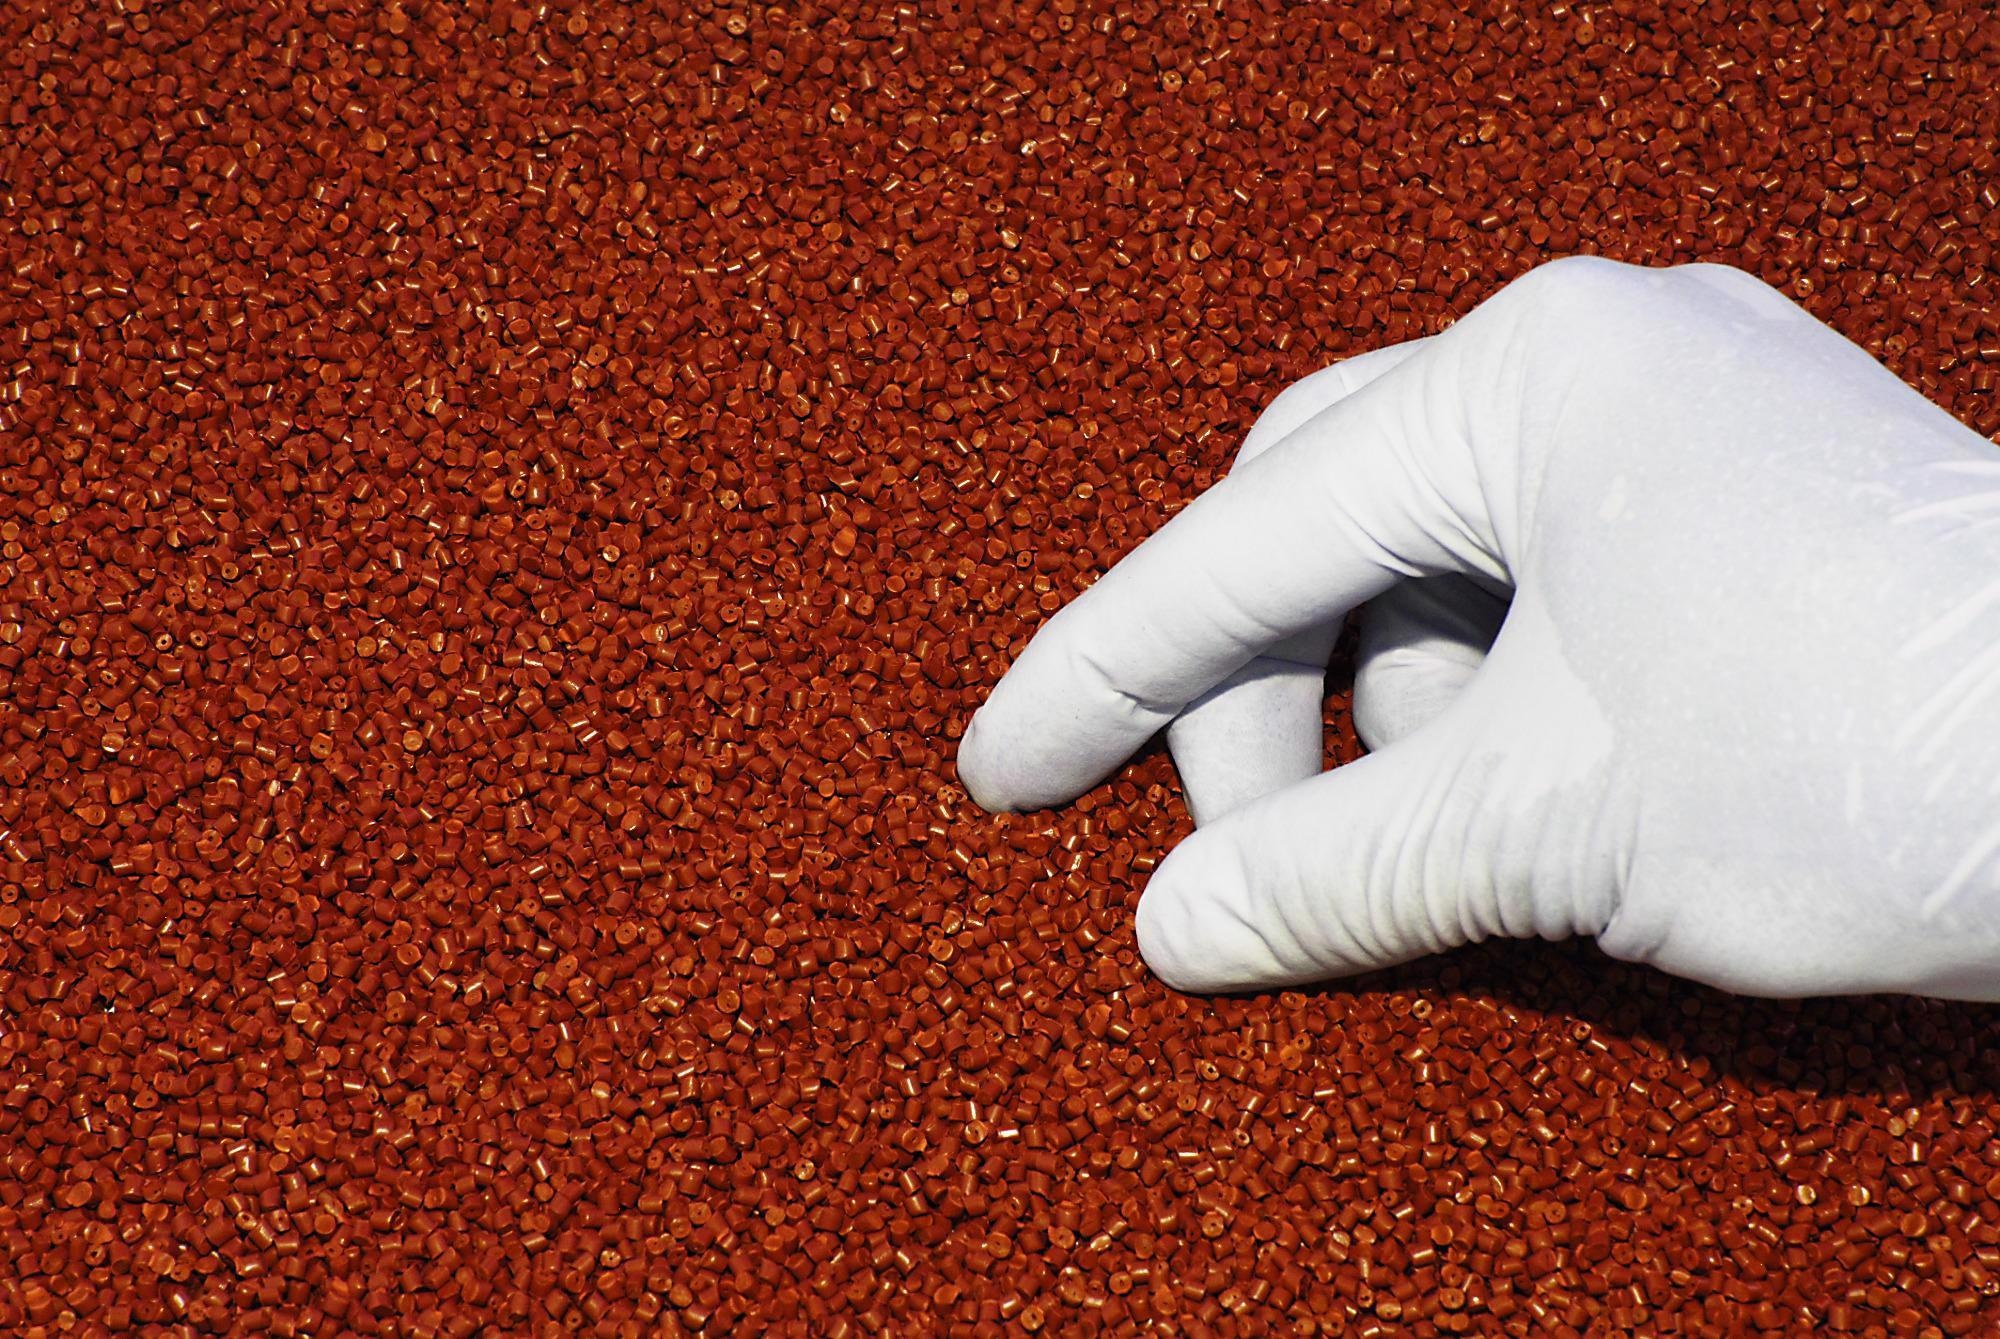
Image Credit:Shutterstock/XXLPhoto
What role does XRF play in maintaining regulatory compliance when working with polymers?
The most common regulations that we see for hazardous materials or hazardous waste are RoHS and WEEE. These are sets of limitations around products’ quantities of certain elements: cadmium, lead, mercury, chrome and bromide.
RoHS and WEEE stipulate that we have to measure different types of chromium and bromides. XRF can only tell us the total amount of chromium or the total amount of bromides, so we regulate to a level below chromium and the bromides, such that even if they were in these forms, they would be below the detection limits.
The US equivalent to RoHS (a European standard) is ASTM F2617. This standard requires monitoring the same elements at the same concentration ranges as RoHS.
We can meet all of these easily with a benchtop XRF system, with limits of detection a factor of a hundred or more, less than their restricted levels. Overall, XRF offers a straightforward means of quantifying and identifying these toxic materials.
When is it more appropriate to use a WDXRF system in polymer analysis rather than an EDXRF system?
This depends on the elements and the concentration range in question. Once we start moving to lighter elements, results via WDXRF are far superior to EDXRF.
For example, if you want to start looking at fluorine, sodium and magnesium at lower concentration ranges, energy dispersive XRF will not provide that value for you – you should consider moving to a wavelength dispersive XRF instead.
The ASCM6247 standard defines lower and upper limits for many of these elements in process control: fluorine from 100 to 300 PPM, sodium from 25 to 200 PPM, magnesium from 10 to 600 PPM, etc.
These are limits that energy-dispersive XRF will not meet, but wavelength dispersive XRF will. We can still achieve all the limits required for heavy metal analysis in WDXRF.
In general, if an energy dispersive XRF system – which is lower cost and available as a smaller benchtop system – is suitable for the analytical techniques and samples required, this is likely a more appropriate choice. However, if an application requires detection that EDXRF cannot accommodate, then it will be necessary to step up and move to a WDXRF system.
Could you explain a bit about the UniQuant tool and how this fits into an overall polymer analysis workflow?
In wavelength dispersive or energy-dispersive XRF, we can perform analysis using standards. This allows us to do semi-quantitative analysis.
UniQuant is an ideal analysis tool for up to 79 elements in situations where appropriate standards are not available, where samples can only be obtained in a very small quantity, the samples have an irregular shape or you want to undertake coding or layer analysis from a substrate.
UniQuant is a peak-based analysis tool, offering much greater accuracy than a scan-based tool.
In a scan-based tool, we typically only spend fractions of a section at each individual 2 theta angle (or the keV in energy-dispersive XRF). This means that when we are just glancing over each peak or location very quickly, meaning it is likely that we will miss a trace element amount.
In a peak-based tool, we move to the known 2 theta location (or keV location), measure this for a set amount of time - from 4 seconds and 12 seconds - and measure on a background position.
Peak to background precision is therefore much better because we are getting much better counting statistics through the analytical time. This ‘peak-hopping’ method is a much more accurate method for semi-quantitative analysis.
The total count time for these types of techniques is anywhere from 14 to 20 minutes, depending on how many elements we are looking at and what power of system we have. We typically look at elements from fluorine to uranium but using WDXRF; we can add other elements such as carbon, boron and nitrogen.
This calibration is maintained through the use of drift correction. It is also manipulable, meaning we can shrink the total analysis time by eliminating elements we know won’t be there.
Alternatively, if we have a particular element that we need to measure with very high precision, we can increase the individual count time on that element without increasing the count time across the board.
What are the benefits of using the ARL QUANT’X tool as part of an XRF workflow, and how does this work?
The Thermo Scientific ARL QUANT’X features a 10-position sample changer, or it can analyze a single polymer sample with a specific platform.
With the sample loaded, we can continue to do the analysis. If we don’t have a method for the sample, we can use UniQuant - the standard routine. A range of programs are available, including vacuum mode.
The analysis is started with the single press of a button, and the system provides updates at each stage of the analysis.
Once the first condition has been evaluated and elements detected, we can automatically label them and then expand around that with further conditions. As the keV level continues to be increased, further conditions may reveal additional elements present but not currently being excited enough to be displayed.
The system progresses from condition to condition, increasing keV and exciting different elements as it does. The elements immediately to the left of the major excitation pump will be excited most efficiently.
Once the analysis is complete, the user is returned to the main menu to look at the results and perform any calculations that need to be done.
About Christopher Shaffer
Christopher Shaffer is XRF, XRD, and OES Business Development Manager at Thermo Fisher Scientific. After graduating college, Chris started his career at the Ferro Corporation managing an analytical laboratory where he first learned the techniques of X-ray diffraction (XRD) and X-ray fluorescence (XRF). Chris joined Thermo Fisher Scientific in 2007 as an XRF applications specialist for North America and then held different roles in Europe and back to the US in product management and business management.


This information has been sourced, reviewed and adapted from materials provided by Thermo Fisher Scientific – Materials & Structural Analysis.
For more information on this source, please visit Thermo Fisher Scientific – Materials & Structural Analysis.
Disclaimer: The views expressed here are those of the interviewee and do not necessarily represent the views of AZoM.com Limited (T/A) AZoNetwork, the owner and operator of this website. This disclaimer forms part of the Terms and Conditions of use of this website.