To fully grasp cement’s properties and long-term effects, measurements such as hydration levels, loss on ignition (LOI), material composition (e.g., calcium carbonate in interground limestone) and assessing kinetic parameters of thermal decomposition are key factors.
EDXRF (energy dispersive X-Ray fluorescence) is a long-established and powerful analysis technique for raw materials and finished products as a method of quality control testing in the cement industry.
WD-XRF (wavelength dispersive X-Ray fluorescence) and XRD (X-Ray diffraction) can also be used, but as with all analytical techniques, they can be limited.1 Thermal analysis is generally utilized as a complementary technique to XRF and XRD when it comes to fully comprehending all of the parameters mentioned above.

Image Credit: Hitachi High-Tech Analytical Science
What is Thermal Analysis?
Thermal analysis is a group of techniques in which a property of the sample is monitored against time or temperature while the temperature of the sample is programmed in a specified atmosphere. The main parameters can be measured by evaluating the effect of temperature and/or time on cement.
These instruments will typically be comprised of a detection unit (e.g. furnace with thermocouples and/or balance), a temperature control unit to manage the furnace temperature and a data recording unit that has the capacity to record the signals of the sensor and the sample temperature for evaluation.
While thermal analysis includes an extensive range of techniques, the primary thermal analysis techniques used are Differential Scanning Calorimetry (DSC), Dynamic Mechanical Analysis (DMA), Simultaneous Thermogravimetry Analysis (STA), Thermogravimetry (TG), or Thermomechanical Analysis (TMA). The principal techniques typically used for cement analysis are DSC and TG.
DSC and TG Explained
DSC is a technique in which the temperature of the sample unit, comprised of a sample and reference material, is varied in a specific program. The temperature difference between the sample and the reference material is determined as a function of temperature. Figure 1 displays a simple representation of a generic heat flux DSC furnace.
By measuring the heat flow, this method facilitates the measurement of exothermic and endothermic reactions, including evaporation which can be utilized to quantify materials like dihydrate and hemihydrate gypsum present in cement.2
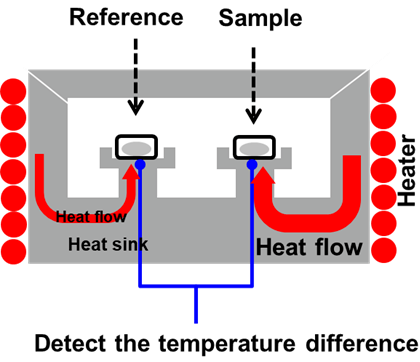
Figure 1. DSC Furnace. Image Credit: Hitachi High-Tech Analytical Science
The TG technique is where the mass of the sample is tracked against time or temperature while the temperature of the sample is programmed in a specific atmosphere. It is is often applied to identify evaporation, decomposition, oxidation and other effects of temperature change that result in changes in mass.
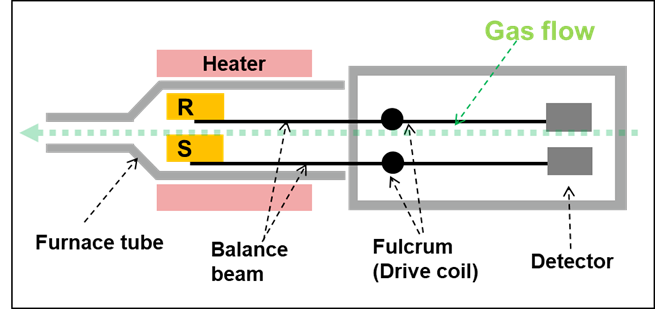
Figure 2. STA Furnace R = Reference and S = Sample. Image Credit: Hitachi High-Tech Analytical Science
STA (TG/DTA or TG/DSC) is similar to TG, but it also incorporates differential thermal analysis within a single apparatus. This is the most frequently used technique when conducting cement analysis as it offers TG and DTA/DSC results, in addition to having the ability to achieve high temperatures (>1000 ̊C). Figure 2 displays an example of a simplified representation of an STA horizontal double beam design.
TG or STA can also be connected to an external detector such as an FTIR, MS or GCMS, which will facilitate the identification of the evolved gas throughout the experiment.
DSC and STA in Practice
Step 1: Installation and Calibration
DSCs and STAs are very easy to use and do not demand much sample preparation. Once installed into a vibration-free area, the system can be operated using only purged gas (Nitrogen and/or dry air) and power.
When calibrating, the DSCs and STAs must be checked regularly to make sure they are within specifications. If a recalibration is necessary, it can usually be conducted by the users.
Step 2: Sample Preparation and Analysis
The sample could take the form of a dry powder or a paste of cured cement, with an accurate known weight. It is then set in a crucible, usually made of aluminum or ceramic, prior to being placed in the sample holder.
Depending on the method, the crucible will be either open, semi-hermitic, or hermetic. Sample weight can vary between 10 and 100 mg depending on the analysis and information required. A reference is also introduced, which is comprised of an empty crucible of the same type as the one used for the sample.
Once the position of the sample has been determined, the temperature program initiates the analysis. The temperature program is either isotherm or increased at a constant rate depending on the necessary method to be performed.
Depending on the system purchased, it may be possible to both insert the samples manually or with the help of an autosampler (which holds up to 50 samples).

Figure 3. Sample positioning in DSC furnace. Image Credit: Hitachi High-Tech Analytical Science
Step 3: Results Interpretation
To interpret the results, TG, DTA and DSC results will be used.
Figures 4 and 5 demonstrate the TG and DTA results acquired from various types of cement. The results were obtained by carefully following ASTM C1872 – 18.
Figure 4 displays the TG (top three curves) and DTG (derivative thermogravimetry) (bottom three curves) results for NBS: SRM633 dried 1 and hydrated 3 in addition to JCM-211M 2. In this instance, the x-axis is representative of the sample temperature whilst the y-axis (left) is the percentage weight (%wt) loss, and the y-axis (right) stands for the derivative of the percentage weight loss.
Each weight loss is due to the various elements within the cement materials and is outlined in Table 1. A complete list of weight loss can be found in a paper published by Collier.1
The difference between samples is seen in the weight loss curves 1 and 2. This determines the difference in component ratio. The increase of free water and the amount of OH groups can also be seen and quantified in the weight loss curves 1 and 3.
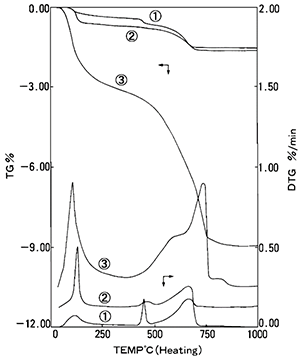
Figure 4. TG (%) and DTG results for 1 NBS (SRM633), 2 JCM-211M, 3 NBS Hydrated. Image Credit: Hitachi High-Tech Analytical Science
Table 1. Weight loss during analysis of cement samples. Source: Hitachi High-Tech Analytical Science
| Temperature |
Weight Loss |
| ~100 ̊C |
Dehydration – free water |
| 120 - 100 ̊C |
Dehydration – gypsum crystal water |
| 400 - 500 ̊C |
Dehydration – calcium hydroxide |
| 500 - 750 ̊C |
Dehydration – OH loss |
Figure 5 displays DTA curves for each cement sample. In each sample, an endothermic peak is present, which demonstrates that there is a relationship between the weight loss and the size of the peak. Since calibrating the DTA signal to quantify heat flow on some instruments is possible, results can be used to quantify components.
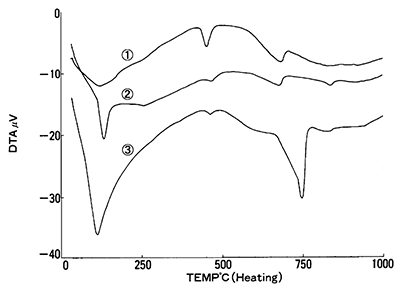
Figure 5. DTA results for 1 NBS (SRM633), 2 JCM-211M, 3 NBS Hydrated. Image Credit: Hitachi High-Tech Analytical Science
DSC is also a vital technique when it comes to testing specific materials which could have an impact on the cement properties. Gypsum is one of the main ingredients of Portland cement; thus, it is crucial to understand its properties prior to and after mixing.
The energy that is released throughout the milling process could generate a partial dehydration of the gypsum to hemihydrate, which could impact the rate of settling in addition to the cement’s long-term properties.3 Since neither XRD nor XRF have the ability to offer this information, DSC could play a central role in the characterization of cement.
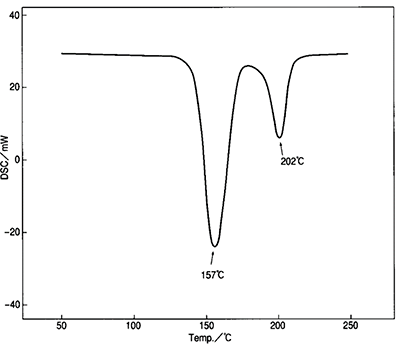
Figure 6. DSC results for dehydrated gypsum. Image Credit: Hitachi High-Tech Analytical Science

Figure 7. Drying equation of gypsum. Image Credit: Hitachi High-Tech Analytical Science
Figure 6 displays the DSC result for gypsum. The two peaks (157 ̊C and 202 ̊C) demonstrate the dehydration process of gypsum, as shown in Figure 8.
By incorporating both peaks, it is clear to see if the stoichiometry of the equation is what is expected and if the milling has had any bearing on the final product.
Thermal analysis, particularly DSC and TG/STA, are both key and complementary techniques to EDXRF, WDXRF and XRD for cement analysis.
They offer valuable information such as hydration levels, loss on ignition (LOI), material composition (e.g., calcium carbonate in interground limestone) and the kinetic parameters of thermal decomposition of cement, which other techniques cannot.
They are relatively easy to use, and with the help of an autosampler, automation of the complete analysis from sample introduction to exporting results is made possible.
Hitachi Thermal Analyzers
Hitachi’s range of thermal analyzers has an unparalleled level of core stability, world-leading sensitivity and advanced capabilities, giving users the complete picture of cement’s thermal behavior. The analyzers have been optimized to identify minute changes to offer visibly improved thermal analysis.
Contact Hitachi today to arrange a demo or to request a quote.
References
- Transition and decomposition temperatures of cement phases – a collection of thermal analysis data, N. C. Collier, Ceramics-Silikaty, 2016, 60 (4), pp 338 – 343
- The quantitative determination of hydrated calcium sulphates in cement by DSC, J. Dunn, K. Oliver, G. Nguyen and I. Sills, Thermochimica Acta, 1987, 121, pp 181-191
- The quantitative determination of hydrated calcium sulphates in cement by DSC, J. Zelic, L. Ugrina, D. Jozic, The First International Proficiency Testing Conference, Sinaia, Romania, 11-13th October, 2007, pp 420-429

This information has been sourced, reviewed and adapted from materials provided by Hitachi High-Tech Analytical Science.
For more information on this source, please visit Hitachi High-Tech Analytical Science.