Sponsored by PerkinElmerAug 30 2022Reviewed by Maria Osipova
At present, there are numerous varieties of epoxy resins available that have a wide range of uses. Epoxy resins, which are well-known for their exceptional performance, are utilized as the foundation for adhesives, coatings, reinforced plastics, and composite materials like fiberglass and carbon fiber that hold up under demanding circumstances.
Epoxies are thermosetting polymer resins where one or more of the resin molecules have epoxide groups. To achieve the ideal molecular weight or viscosity for the intended usage, the chemistry can be modified. As a result, epoxy resins have a variety of application areas.
PerkinElmer DMA 8000. Image Credit: PerkinElmer
Epoxy resins can be used in a variety of applications, including overmolding integrated circuits, surface coatings, barriers for LEDs and electrical components, high-tension electrical insulators, wetting out fiberglass, and structural component adhesion, among others.
Epoxy resins are integral to the electronics sector since they are used to make insulators, motors, transformers, and generators. Epoxy resins are also perfect for covering electronics to shield them from environmental hazards, including moisture, dust, and short circuits.
It is essential to study and comprehend the characteristics of epoxy resins since they are also employed in the production of adhesives, plastics, paints, coatings, primers and sealants, flooring, and materials for use in building and construction applications.
This application note shows how a PerkinElmer® DMA 8000 can be used to characterize the mechanical characteristics of an epoxy-based printed circuit board (PCB). The modulus of the PCB is measured, which provides an important parameter for the manufacturer.
Additionally, the glass transition temperature is precisely recorded, providing data on the useful temperature range for the material.
Experimental
One of the best ways to study relaxation events is using dynamic mechanical analysis (DMA). Measurements are also made of the material’s stiffness, which could affect how useful it is in practical applications.
DMA makes it simple to see the glass transition (Tg), a crucial process in all materials. When a precise modulus is required, three-point bending geometry is thought to be the best option.
The instrument’s influence on the measurement is minimal since there is no “clamping” of the sample. DMA operates by providing an oscillating force to the material and measuring the sample’s subsequent displacement. This allows for the determination of stiffness as well as the calculation of the modulus and tan δ. Tan δ is the proportion of storage modulus to loss modulus.
The damping qualities of the material can be ascertained by measuring the phase lag between the displacement and the applied force. Tan δ is plotted against temperature, and glass transition is normally observed as a peak as the material tends to absorb energy as it passes through the glass transition.
As the industry gears itself for the use of lead-free solder in manufacturing, there has been a surge in interest in assessing the physical qualities of PCBs in recent years. Electrical equipment sold after mid-2006 is required by European law to be free of lead soldering.
This problem has led to the investigation of new materials for PCB production. For any material used as an electrical component, the glass transition temperature and the stiffness (and modulus) of the material at various temperatures are critical factors.
Temperature Scan of PCB.
Prior to beginning the DMA experiment, the sample was put in 3-Point Bending clamps and cooled to –150 °C.
Source: PerkinElmer
| Equipment |
Experimental Conditions |
| DMA 8000 1 L Dewar |
Sample: |
Epoxy based PCB |
| Geometry: |
3-Point Bending |
| Dimensions: |
17.5 (l) x 6 (w) x 1.5 (t) mm |
| Temperature: |
-150 °C to 250 °C at 3 °C/minute-1 |
| Frequency: |
0.1, 1.0 and 10.0 Hz |
Results and Conclusion
This material’s glass transition is depicted in Figure 1 as a peak in the tan δ and a decrease in modulus. A clear frequency dependence can be seen, which suggests that the transition is a relaxation. The material’s modulus is essentially constant at 2.3 × 10¹⁰ and 5.0 × 10⁹ Pa, respectively, before and after this transition.
The peak in the tan δ is used to establish the glass transition temperature, which is shown to vary depending on frequency between 142.6 °C and 151.8 °C.
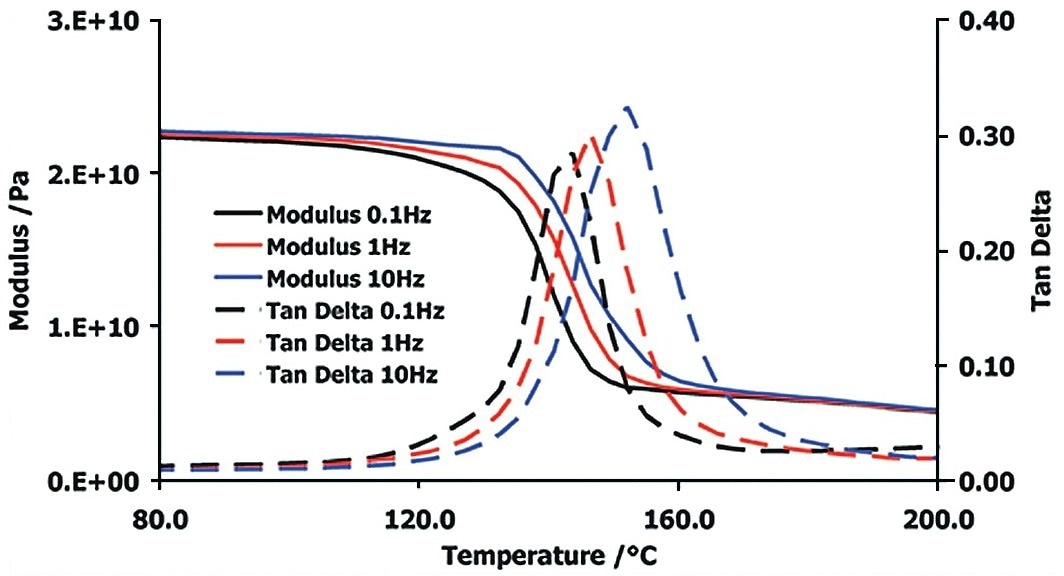
Figure 1. Sample fixture for tension mode. Image Credit: PerkinElmer
This data was gathered using a –150 °C initial temperature. Another relaxing event can be seen by scaling up the lower temperature data (as depicted in Figure 2).
Given that both the modulus and tan measurements exhibit a frequency dependency, this transition is unmistakably a relaxation. This shows that DMA is a very effective method for tracking these lower temperature shifts.
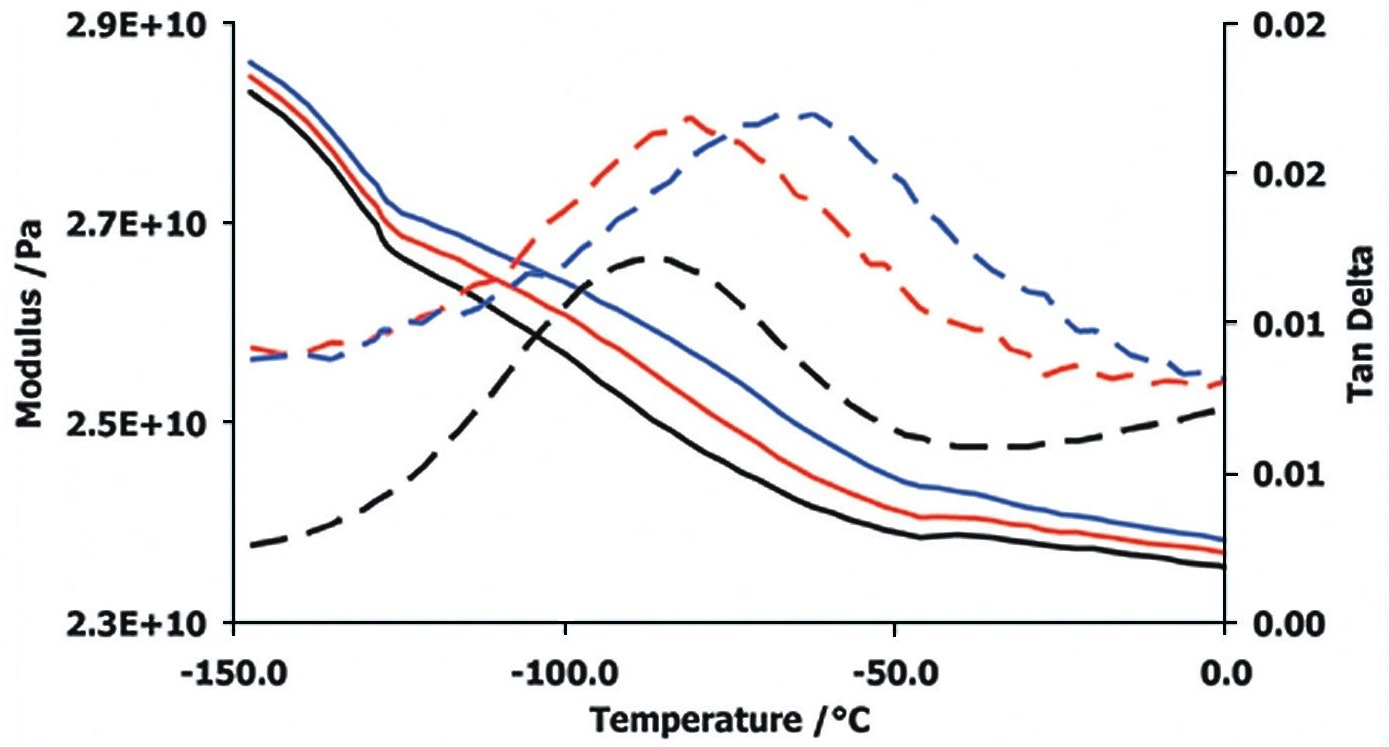
Figure 2. Displacement from aluminum sample. Image Credit: PerkinElmer
It has been demonstrated that a precise modulus can be attained for this epoxy-based PCB material by choosing the geometry of 3-Point Bending. It is also simple to characterize the glass transition temperature.
The sensitivity of DMA to observe such an event also allows for the identification of a relaxation. Even lower temperature transitions can be easily detected with this experiment’s equipment because it can fall as low as –190 °C.

This information has been sourced, reviewed and adapted from materials provided by PerkinElmer.
For more information on this source, please visit PerkinElmer.