Sponsored by PerkinElmerAug 30 2022Reviewed by Maria Osipova
The use of post-consumer recycled high-density polyethylene (HDPE) has steadily increased over the last few years.
Image Credit: PerkinElmer
Based on a recent Association of Post-Consumer Plastic Recyclers report, roughly 974,000,000 pounds of HDPE were reused in 2011.1
As a result, recycled HDPE has become a key raw material for many HDPE-based goods as a green, cost-effective alternative to virgin HDPE.
Due to its great tensile strength, HDPE is primarily employed in a variety of packaging, consumer goods, fibers, and textiles. Due to its superior chemical and hydrolysis resistance, HDPE is also used in pipes and fittings, as well as in automotive fuel tanks, wiring, and cables.
Plastic drinking bottles are the most commonly recycled HDPE goods. Several of these bottles contain polypropylene (PP) lids and pour spouts, a polymer with similar physical qualities to HDPE.
As a result, PP is a typical contaminant in post-consumer reused HDPE resin and can impair end-product efficiency (e.g., products can be more brittle and susceptible to stress cracking). Recycled bottles have also been employed in the production of vehicle components.
Ford declared the reuse of 1.2 billion recycled bottles in 2018. For the entire year, this amounted to 250 recycled plastic bottles in each of its produced vehicles.2
Processors must monitor and manage the proportion of PP retained in recycled resin to maintain excellent quality. Fourier Transform Infrared Spectroscopy (FT-IR) is a dependable technique for this purpose, and, to that end, the PerkinElmer Spectrum Two™ FT-IR is considered an accurate, easy-to-use system for measuring the amount of PP in recycled HDPE resin.
The uses of the PerkinElmer Spectrum Two are outlined below.
Experimental
Advanced Blending Technologies we used to prepare the standards (Table 1).
Samples of virgin HDPE pellets were dry-blended with virgin homopolymer PP pellets at the proportions listed in Table 1 (which encompass a range of 3-12%, which is normal for amounts of PP in recycled HDPE resin), then hot melt combined through a ¾-inch single screw laboratory extruder.
Table 1. Standards at Four Different Blends of Polyethylene (PE) and Polypropylene (PP). Source: PerkinElmer
| Name |
Polypropylene (%) |
Polyethylene (%) |
| 12% PP 4 |
12 |
88 |
| 9% PP 4 |
9 |
91 |
| 6% PP 4 |
6 |
94 |
| 3% PP 4 |
3 |
97 |
The samples were (i) dry blended and then (ii) re-extruded two more times for three runs through the extruder to guarantee a homogeneous combination.
The spectra of the standards were collected using a PerkinElmer Spectrum Two equipped with a diamond single bounce ATR and four co-adds at 4 cm-1 spectral resolution.
After no additional sample preparation, the PP/HDPE resin pellets were placed/pressed on the diamond crystal and easily measured. Each standard was evaluated 5-6 times with various pellets.
With the database, PerkinElmer Spectrum Quant software was used to create a calibration technique.
Spectrum Quant is a comprehensive software package that incorporates the linear regression-based Beer’s Law, which allows users to use the area, peak or highest peak, or peak ratio with baseline settings. The software also has quadratic and cubic curve fitting options, which were not necessary for this investigation.
The PE peak (in black) centered at 719 cm-1 (attributed to methylene group rocking) was restricted against the PP peak (in green) centered at 1,376 cm-1 for this analysis (attributed to methyl group symmetrical bending).
Figure 1 shows representative spectra (overlaid). The peak ratios were then utilized to create the calibration graph, which is shown in the following part of Figure 2.
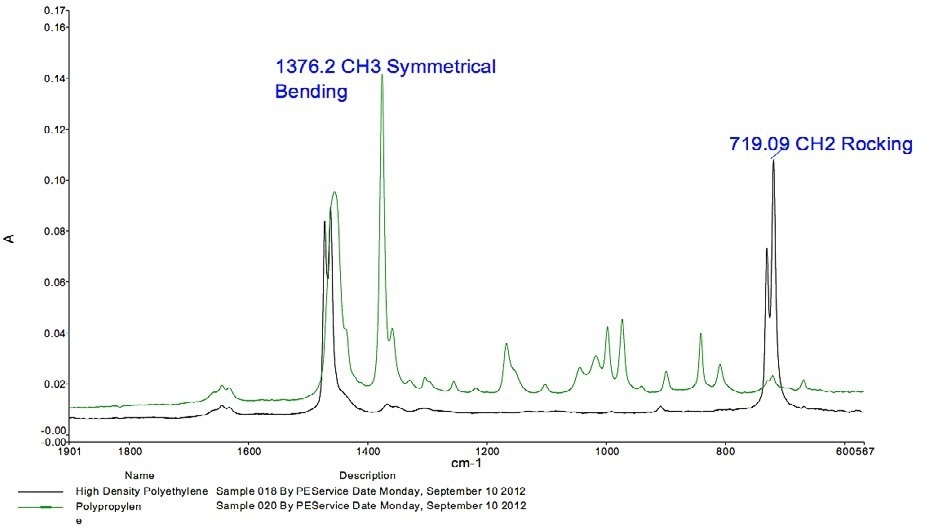
Figure 1. Spectral Comparison of High-Density Polyethylene and Polypropylene. Image Credit: PerkinElmer
Results
Figure 2 shows a strong linear fit for estimated PP (depending on peak ratio) and the specified values, with a regression correlation of approximately 0.999.
The standard deviation of prediction (SEP) is minimal, around 0.19%, showing that the model is stable. The validation of the model is a critical stage in any quantitative investigation. The Spectrum Quant program was used for independent validation.
The validation results for PP are shown in Table 2. The residual values are often low, which is compatible with the strong linear fit in the calibration curve.
Table 2. Validation Results for PP. Source: PerkinElmer
| Validation Samples Specified |
|
Calculated |
Residual |
| 12% PP validation |
12 |
11.7817 |
0.218282 |
| 9% PP validation |
9 |
9.30215 |
-0.302153 |
| 6% PP validation 1 |
6 |
5.60739 |
0.392614 |
| 6% PP validation 2 |
6 |
5.70573 |
0.294273 |
| 3% PP validation |
3 |
3.17936 |
-0.179363 |
Conclusion
Due to the innovative architecture and built-in algorithms, high-quality spectra can be obtained in seconds, without sample preparation, on the PerkinElmer Spectrum Two with a single-bounce ATR attachment.
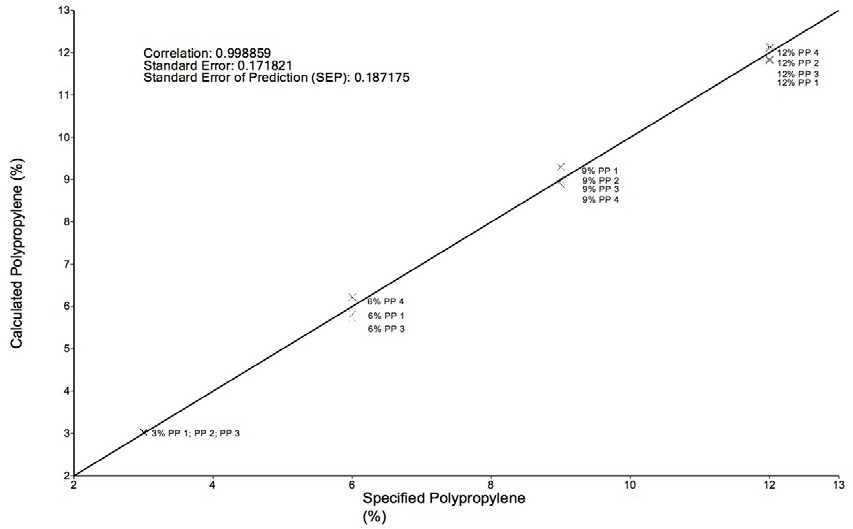
Figure 2. Calibration Model for PP. Image Credit: PerkinElmer
These findings were produced fast, in a couple of minutes; the most time-consuming element of the analysis was preparing the “contaminated” resin standards.
Finally, the calibration curve demonstrated great linearity and stability, showing that Spectrum Two is an appropriate tool for rapid screening evaluation for the amounts of PP in recycled HDPE reported here. It should be highlighted that for larger concentrations, a second calibration may be required to account for the greater PP contents in recycled HDPE resin.
Reference
- Association of Post-Consumer Plastic Recyclers report
- Recycled plastics in the automotive industry - Knauf Industries Automotive (knaufautomotive.com)

This information has been sourced, reviewed and adapted from materials provided by PerkinElmer.
For more information on this source, please visit PerkinElmer.