Sponsored by MicrotracNov 28 2022Reviewed by Emily Magee
Lithium-ion battery optimization and safety are crucial to reducing cell aging. In this case, one of the most important elements is the particle size of the bioactive constituents such as cathode, anode, and separator material.1 Figure 1 depicts the general configuration of a lithium-ion battery.
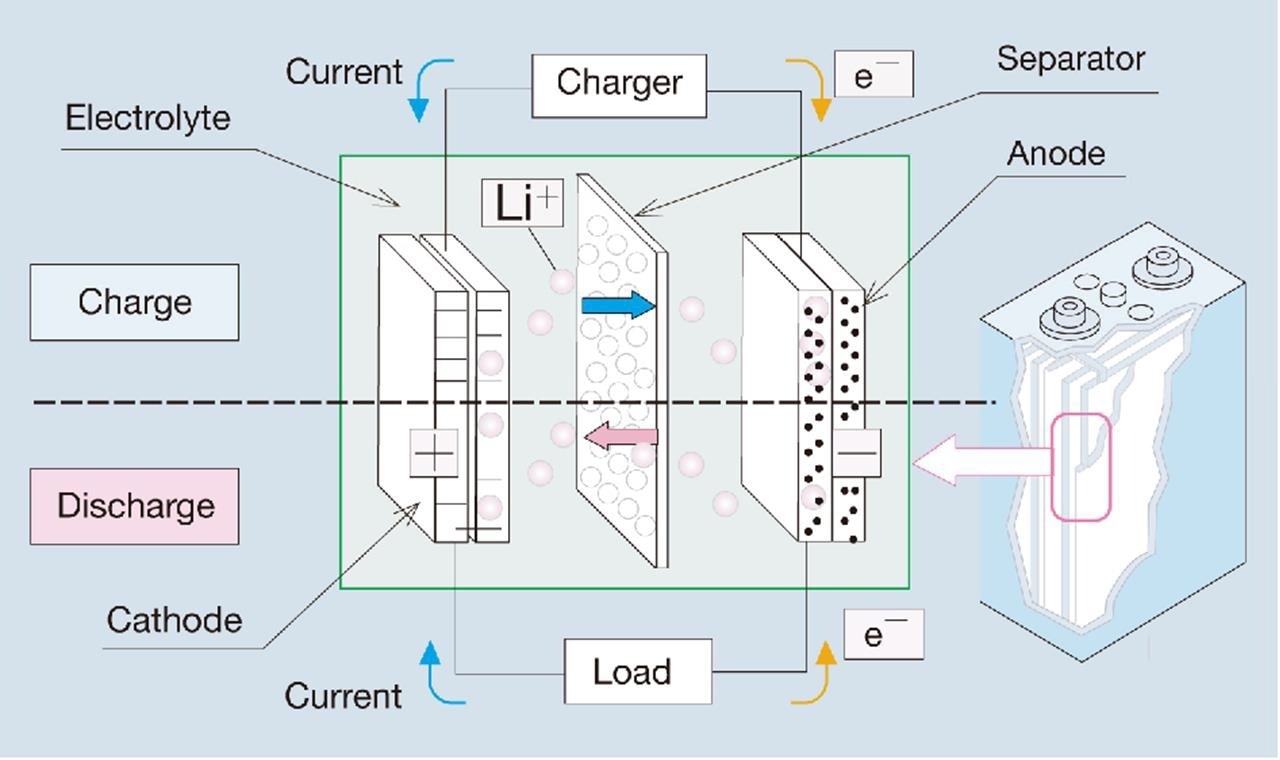
Figure 1. Setup of a lithium-ion battery.2 Image Credit: Microtrac MRB
The particle size of the anode, cathode, and separator material influences battery electrochemical performance. Smaller particle sizes result in shorter pathways in solid materials and reduced overpotential, which improves the charge/discharge rate (C rate).1
Smaller particle size means more surface area, which means more passivation at the solid electrolyte interphase, which can irreversibly limit battery capacity.1
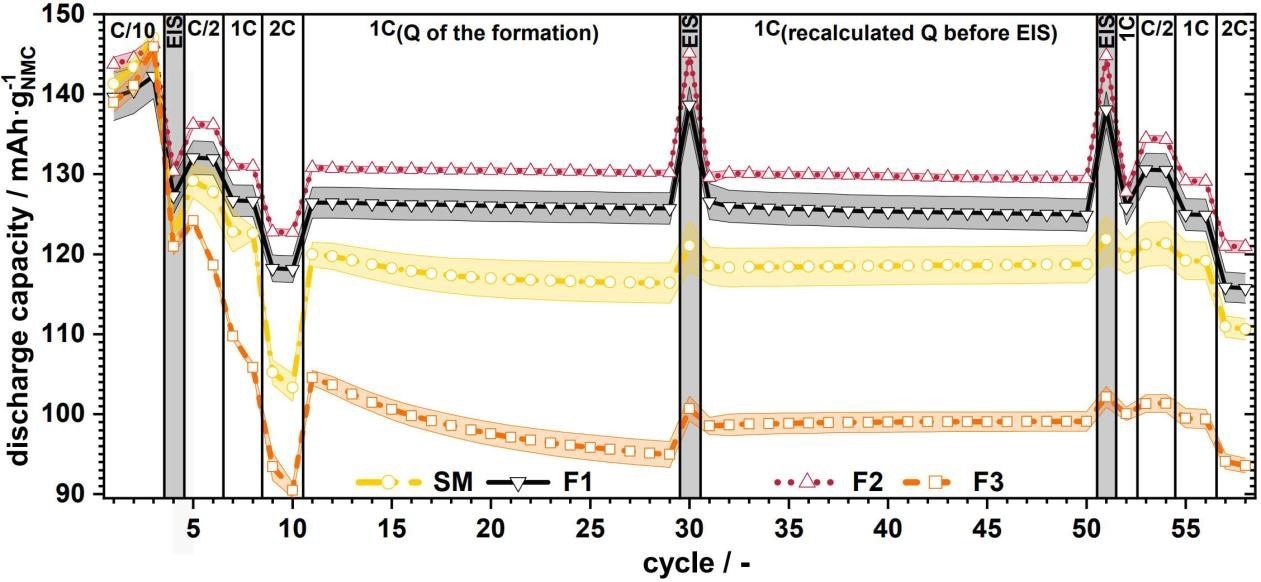
The following example demonstrates how crucial particle size distribution is for the charging and discharging process and battery aging. Figure 2 depicts the specific discharge capacity vs. the cycle for full material cells with varying particle sizes 1
| Sample |
X10 / μm |
X50 / μm |
X90 / μm |
X98 / μm |
| SM |
1.44 |
12.90 |
28.63 |
39.62 |
| F1 |
0.84 |
1.53 |
2.82 |
4.01 |
| F2 |
3.96 |
5.86 |
8.65 |
10.43 |
| F3 |
10.34 |
17.45 |
30.89 |
69.68 |
Figure 2. Specific discharge capacity vs. cycles for full cells with source material (SM) and F1 to F3 with C-rate variations; the colored range indicates the corresponding standard deviation.1 Image Credit: Microtrac MRB
Figure 3 depicts the materials used in the production of batteries.
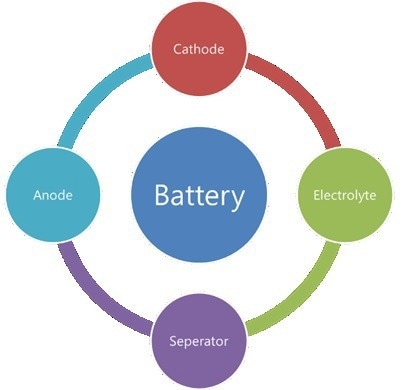
Figure 3. Battery Components. Image Credit: Microtrac MRB
In this example, laser diffraction (ISO 13320) methods were used to analyze the particle size distributions of all battery components. The experiments were conducted in aqueous or isopropanol dispersions. The SYNC analyzer from Microtrac was utilized for the assessment, which has a measuring range of 10 nm to 4 mm and is suited for all sorts of powders and dispersions.
The standard camera enables dynamic image analysis (ISO 13322-2) and laser diffraction, providing information on particle morphology. Image analysis dramatically improves sensitivity to minimal levels of large particles.
Laser Diffraction (LD) and Dynamic Image (DIA) Measurement
With the SYNC Microtrac MRBenhanced its established Tri-Laser technology by powerful image analysis that provides customers with a fresh and distinctive measurement experience. Laser diffraction (LD) particle size measurement is the most extensively used technique in research and industry, and it is regarded as the standard for quality control.
The measurement is determined by the interaction of laser light with dispersed particles. This results in a scattered light pattern recorded using Microtrac MRB technology over an angle range of 0.02–163 °, allowing the size distribution to be determined. Two detector arrays and three lasers are used in the SYNC. Red lasers or a combination of red and blue lasers can be used in the analyzer (Figure 3).
Small particles scatter light to large angles, and large particles scatter light to small angles. Microtrac MRB’s novel modified Mie scattering theory is used in the evaluation. This algorithm generates precise particle size distributions for round and nonspherical particles and transparent, reflecting, and absorbing materials.
Modern particle analyzers are frequently requested to perform tasks other than simple size analysis. Dynamic Image Analysis (DIA) offers valuable insights into particle shape and, as a result, extensive information on physical material properties.
Unlike image analysis, which may assess the length and width of the particles separately in addition to the form characteristics, laser diffraction only gives an equivalent diameter based on the assumption that the particles are spherical. A high-resolution digital camera captures a particle stream illuminated by a stroboscopic light source. The images are used to make a video file of the particle stream.
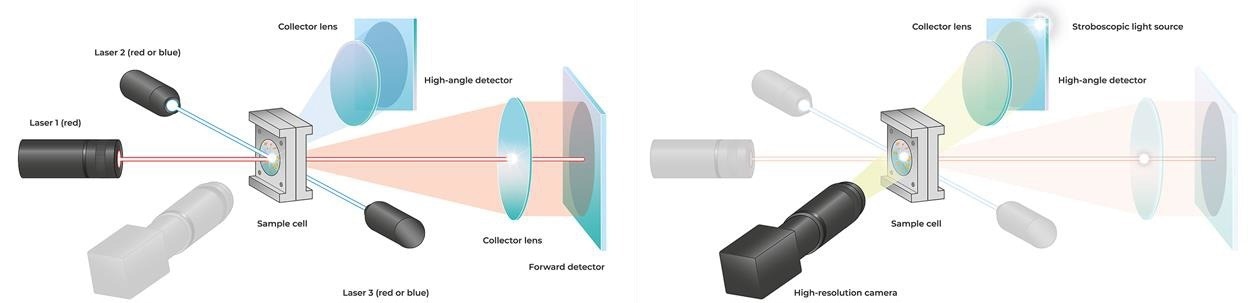
Figure 4. Optical design of the SYNC analyzer. For laser diffraction (left), three red or blue lasers and two detector arrays are used. Dynamic image analysis (right) is performed in the same measurement cell using a stroboscopic light source and a camera. The particles are detected as shadow projections. Image Credit: Microtrac MRB
Samples
Anode material
- Spherical graphite anode material was analyzed in isopropanol (IEP)
- Synthetic graphite and milled coke were evaluated in IEP, water with Triton X, and dry, as illustrated in Figure 5
- Silicon anode material
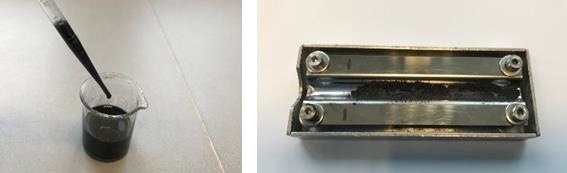
Figure 5. Wet and dry sample preparation of milled Coke. Image Credit: Microtrac MRB
Cathode Material
Separator
Electrolyte
Results
Figure 6 shows the particle size distributions of a silicon anode material, a cathode material, a solid-state electrolyte, and a separator material.

Figure 6. Different battery materials. Image Credit: Microtrac MRB
Some synthetic graphite and milled coke were evaluated in isopropanol, water with Triton X as a dispersant, and the original powder was tested in dry mode with the TurboSync. Table 1 clearly shows that it has very strong repeatability across all three types of measurement.
Table 1. Results of the comparison of different methods to measure the particle size. Source: Microtrac MRB
| percentile |
Graphite
IPA |
Graphite
water |
Graphite
dry |
Milled coke
IPA |
Milled coke
water |
Milled coke
dry |
| X10 / μm |
7.16 |
6.93 |
7.15 |
1.89 |
1.98 |
2.22 |
| X50 / μm |
12.22 |
11.95 |
12.38 |
9.26 |
9.93 |
8.71 |
| X90 / μm |
24.82 |
22.44 |
27.30 |
22.46 |
21.41 |
23.73 |
Figure 7 depicts the corresponding passing curves of the measurements, which describe the repeatability achieved by the various measurement methods. The graphite sample is on the left, and the milled coke is on the right.
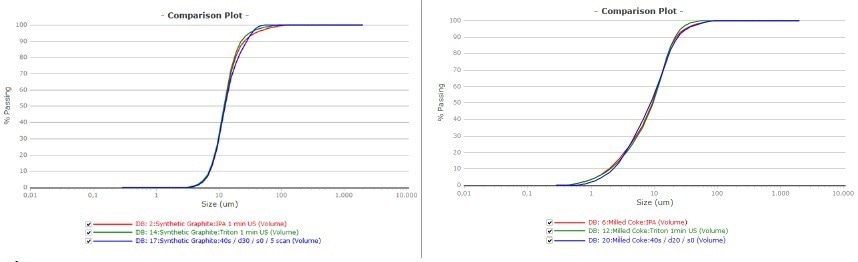
Figure 7. Passing curve of graphite (left) and milled coke (right). Red was measured in IPA green in water and blue was the dry measurement. Image Credit: Microtrac MRB
The SYNC performed a dynamic image analysis (DIA) in addition to a laser diffraction measurement—all at the same time, in the same flow path, on the same sample cell, and with the same software.
The strength of the combination of both methods is demonstrated here, as is the benefit of Microtrac’s patented blend algorithm, which displays both results in a single graph. It can, for instance, be used to identify large particles, as illustrated in Figures 8 and 9.
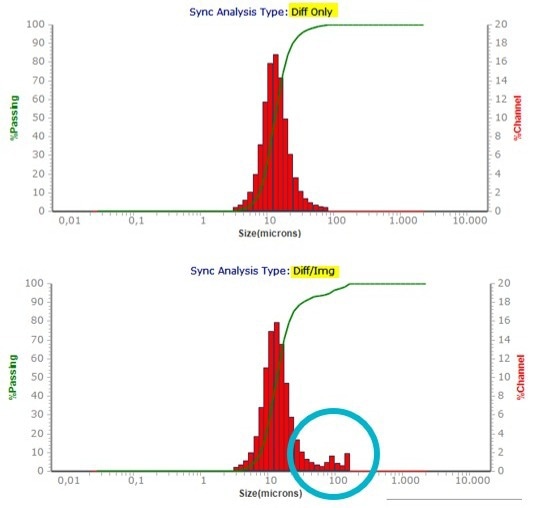
Figure 8. Compare of a Laser Diffraction only and blend result of synthetic graphite. Image Credit: Microtrac MRB
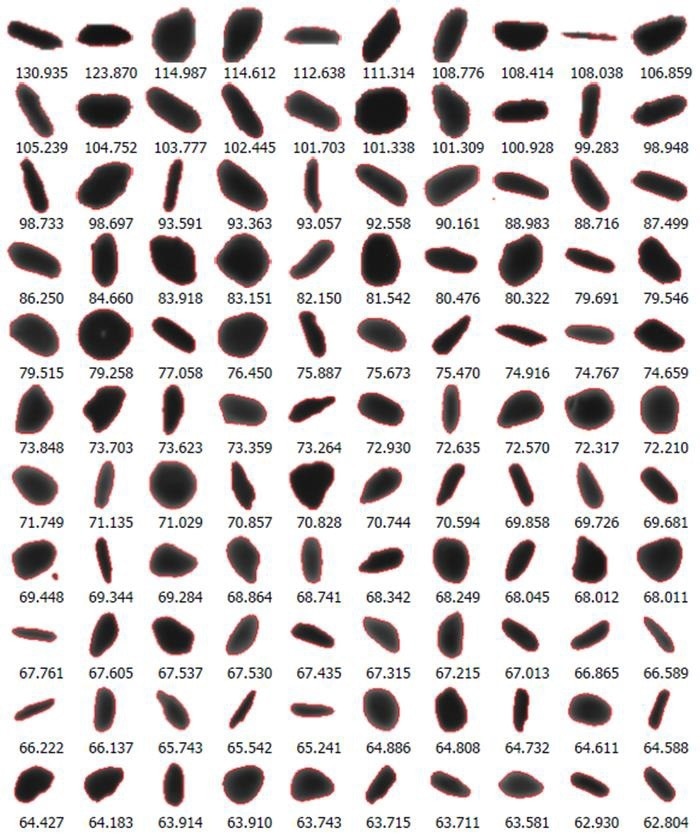
Figure 9. Image of some oversized particles in synthetic graphite sample. Image Credit: Microtrac MRB
A similar result was achieved with milled Coke.
The Sync was also used to evaluate a spherical graphite anode material. In this case, the material was disseminated in isopropanol. Figure 10 shows a laser diffraction result with an X50 of 8.2 µm.
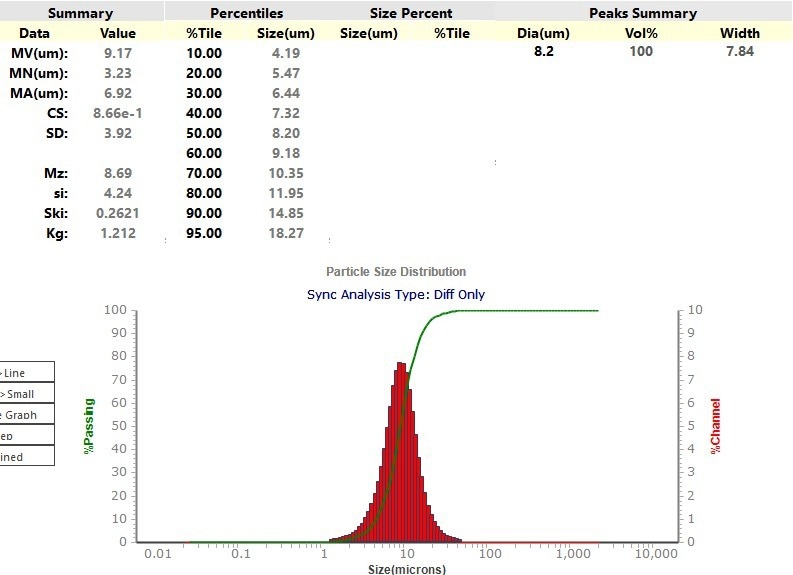
Figure 10. Particle size distribution of the Laser Diffraction result from the Sync. Image Credit: Microtrac MRB
The DIA of the SYNC was also employed during this measurement to determine the particle sphericity. The advantage of combining LD and DIA is seen in this instance. Figure 11 depicts the particle distribution and sphericity in area-equivalent diameter (Da). A perfect spherical particle has a value of 1. The scatter plot shows that the majority of the particles in the sample are approximately spherical, but some are not.
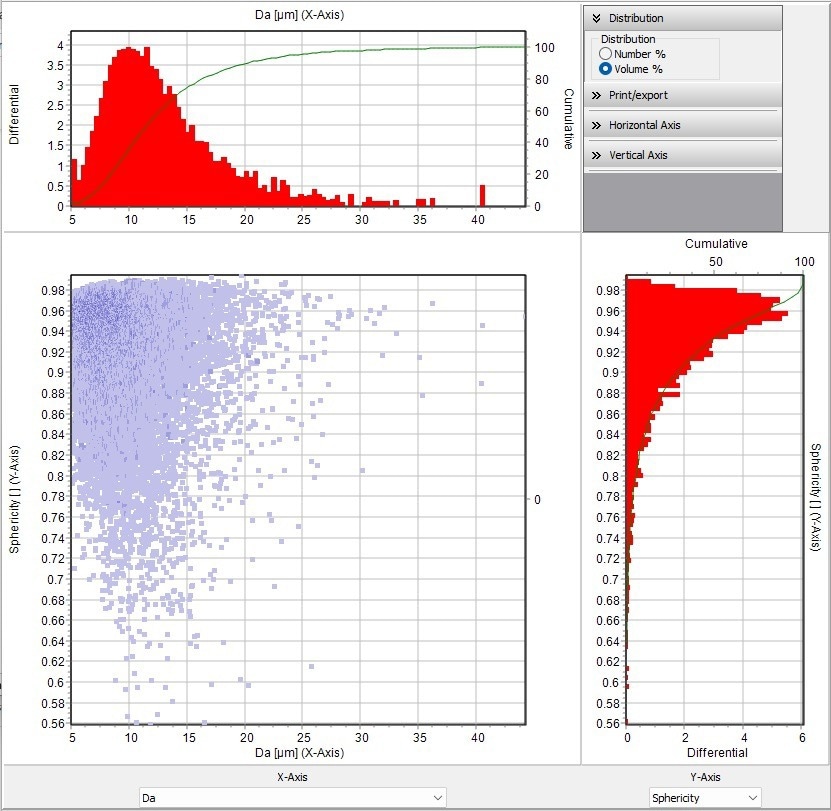
Figure 11. Scatter diagram shown the area equivalent diameter vs. sphericity. The scatter diagram shows the location of each particle in the sample with respect to the value plotted on the top X-axis and the Y-axis on the right. Sphericity (scale of 0.56 to 1), 1 would be a perfect sphere. Image Credit: Microtrac MRB
Images of the particles were also captured and displayed in Figures 12a (spherical particles) and 12b (non-spherical particles).
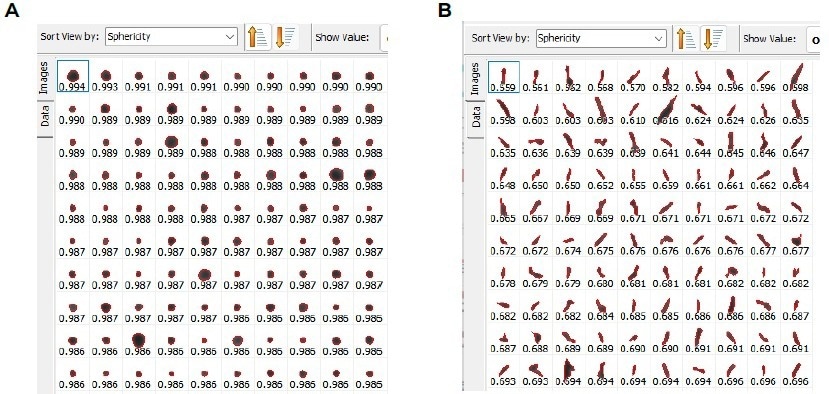
Figure 12. A few selected particles were shown as an example for a) spherical particles and b) non - spherical particles. Image Credit: Microtrac MRB
Summary
Requiring only a few seconds of measurement time, laser diffraction is appropriate for the quick and simple characterization of battery materials. Because the measurement instrument automatically rinses and cleans itself, sample run times of 1–2 minutes are feasible. The approach is distinguished by its high reproducibility and adaptability. Dependable reflective particle evaluation algorithms yield reliable results.
The simultaneous use of image analysis significantly increases the likelihood of identifying small amounts of large particles.
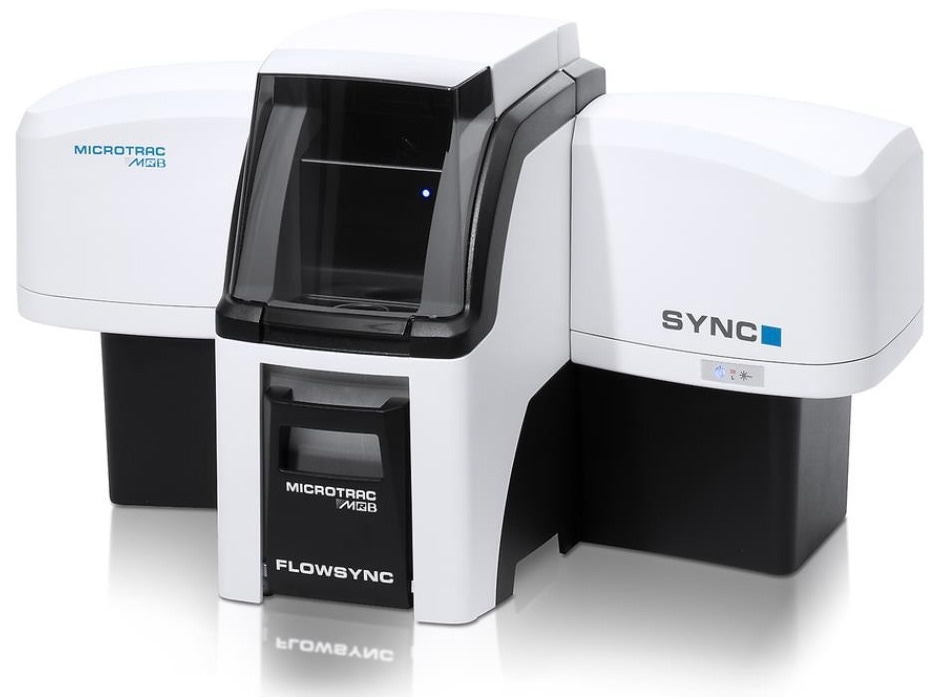
Image Credit: Microtrac MRB
References
- BLÄUBAUM, Lars, et al. Impact of Particle Size Distribution on Performance of Lithium‐Ion Batteries. ChemElectroChem, 2020, 7. Jg., Nr. 23, S. 4755-4766.
- HASHIMOTO, Tsutomu, et al. Development of Grid-stabilization Power-storage Systems Using Lithium-ion Rechargeable Batteries. Mitsubishi Heavy Industries Technical Review, 2011, 48. Jg., Nr. 3, S. 48-55

This information has been sourced, reviewed and adapted from materials provided by Microtrac MRB.
For more information on this source, please visit Microtrac MRB.