Whisky is a distilled alcoholic beverage named after the Gaelic term ‘uisge beatha,’ which translates to ‘water of life.’ The drink is made from fermented grain mash, and the wide variety of whisky flavors available are produced using different grains.
When whisky bottles are sold, they will have an a% abv, which refers to how much ethanol is in the bottle. Whisky typically has 40% alcohol by volume (abv), so 40% of the bottle should be ethanol. The Scotch Whisky Association reports that 44 bottles of Scotch Whisky are exported every second, with exports of that alcoholic beverage expected to reach £4.5 billion in 2021.1
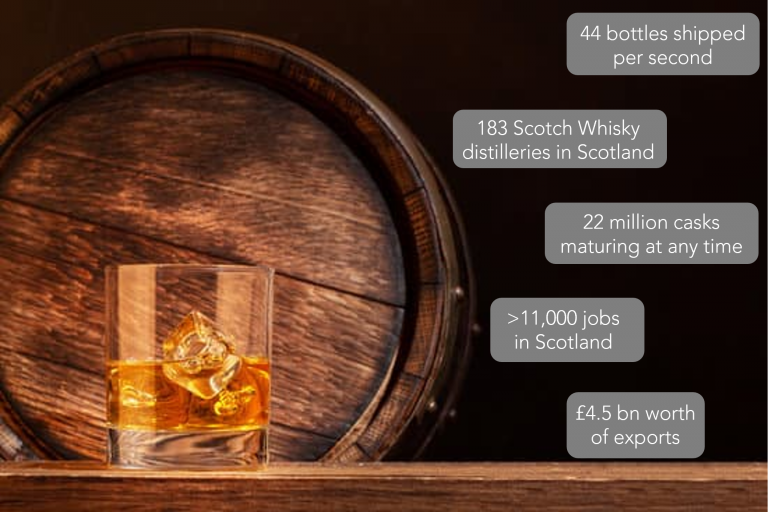
Figure 1. 2021 Scotch Whisky facts & figures. Image Credit: Edinburgh Instruments
Selling alcoholic beverages, particularly spirits, fraudulently is a worrying and potentially dangerous way for vendors to boost their profits.
There are two common ways in which alcohol is sold illegally, firstly is the sale of watered-down alcohol.
Either this is done in bulk, where bottles are sold with false percentage alcohol content printed on them, or it is done in bars, where spirits are diluted after being bought in bulk. When methanol rather than ethanol is used to make spirits, the second problem associated with alcohol fraud is more sinister.
Alcohol dehydrogenase is a liver enzyme that breaks ethanol down into water and carbon dioxide, which are both safe substances. Methanol, meanwhile, is toxic to humans and is frequently found in antifreeze.
The only difference between the two molecules is one carbon and two hydrogen atoms, but when methanol is consumed, the alcohol dehydrogenase enzyme converts the methanol into formaldehyde which is then quickly metabolized into formic acid.
Methanol is toxic after ingestion, inhalation, and dermal exposure, according to Public Health England’s toxicological overview. Methanol poisoning can have a variety of negative effects, including but not restricted to central nervous system depression, nausea, blindness, coma, and death.2
Checking the amount of ethanol in whisky bottles is necessary to ensure that the products are being sold authentically, and making sure there is no methanol present in the bottles is essential to keeping the products safe for consumption.
This article outlines how Raman spectroscopy can offer quantitative and qualitative analysis of whisky samples.
Materials and Methods
The analysis outlined below was carried out using an RM5 Raman Microscope outfitted with a cuvette holder and a 785 nm excitation laser. For the standard solutions, Merck supplied pure ethanol and methanol; whisky samples were obtained locally. Aqueous solutions of 20%, 40%, 60%, 80%, and 100% ethanol were prepared to form the calibration curve.
The same measurement parameters were used to capture the Raman spectra for each solution and sample: 100% laser power, 0.5 second exposure time, 300 gr/mm grating, 100 µm slit, and 2 mm pinhole.
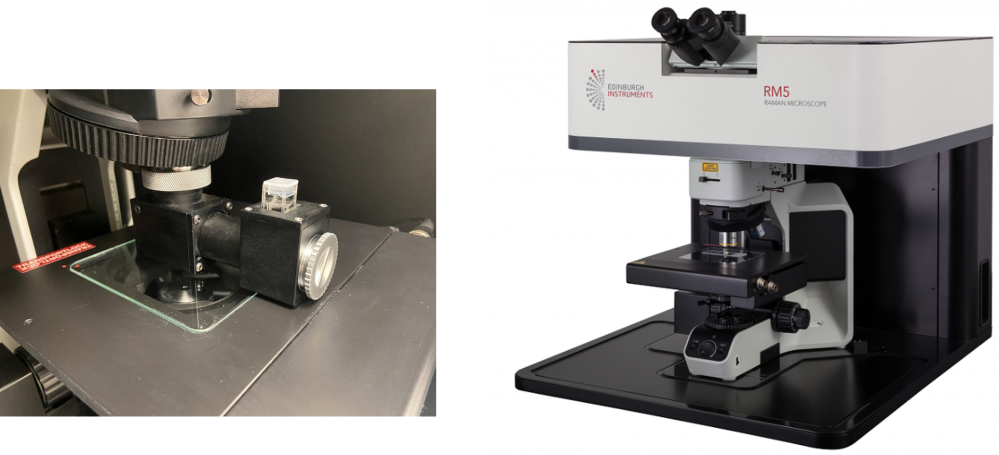
Figure 2. Cuvette holder (left), RM5 Raman Microscope (right). Image Credit: Edinburgh Instruments
A whisky sample was spiked to create a whisky solution with a 10% methanol concentration. Using a 300 gr/mm grating to capture the entire spectral range in one image and a 1200 gr/mm grating to see higher spectral definition in the fingerprint region of the spectrum (300–1800 cm–1), a comparison of unflavored whisky, spiked whisky, and methanol was conducted.
Verifying Ethanol Content
A calibration (or standard) curve is a tool used in analytical chemistry to compare an unknown sample’s concentration to a series of samples with known concentrations. For ethanol, a known peak associated with the C-C-O symmetric stretching vibration is chosen at about 880 cm–1.
Using these data points as a starting point, a calibration curve can be made, as shown in Figure 3. The peak area will increase linearly with increasing ethanol concentration.
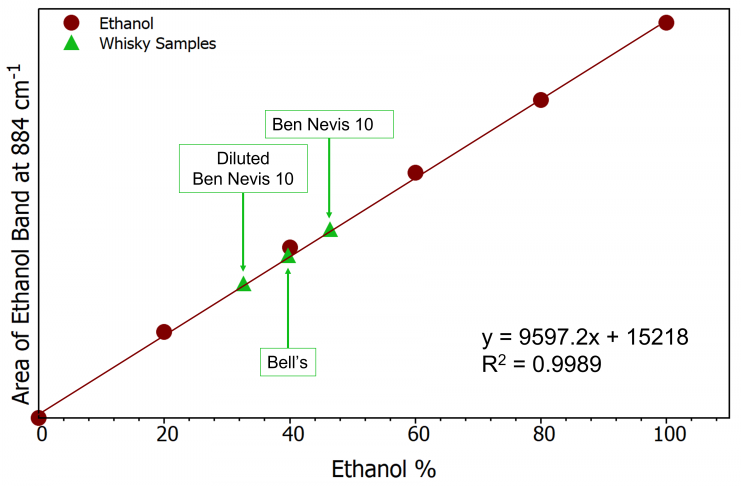
Figure 3. Ethanol calibration curve (burgundy) and whisky samples (green). Image Credit: Edinburgh Instruments
The ethanol content of the whisky samples can be ascertained and plotted on the calibration curve using the equation of the line after obtaining the calibration curve (Figure 3). On the bottles of the two whisky samples, the ethanol percentage was noted (Table 1).
A sample was diluted with water, and its Raman spectrum was again acquired to demonstrate how Raman spectroscopy can be used quantitatively to determine the amount of ethanol in a substance. The calibration curve enables the ethanol % to be calculated at 32.6% as the area of the ethanol band decreases as expected.
Table 1. % Ethanol results Whisky Samples. Source: Edinburgh Instruments
| Sample |
Labeled Ethanol % |
Measured Ethanol % |
| Ben Nevis 10 |
46% |
46.4% |
| Bell’s |
40% |
39.7% |
| Diluted Ben Nevis 10 |
N/A |
32.6% |
Identifying Methanol in Whisky
Figure 4 shows that methanol and ethanol have distinct Raman spectra despite their close chemical proximity. Raman spectroscopy typically uses two bands, one at approximately 1035 cm–1 and the other at approximately 2845 cm–1, to detect the presence of methanol.
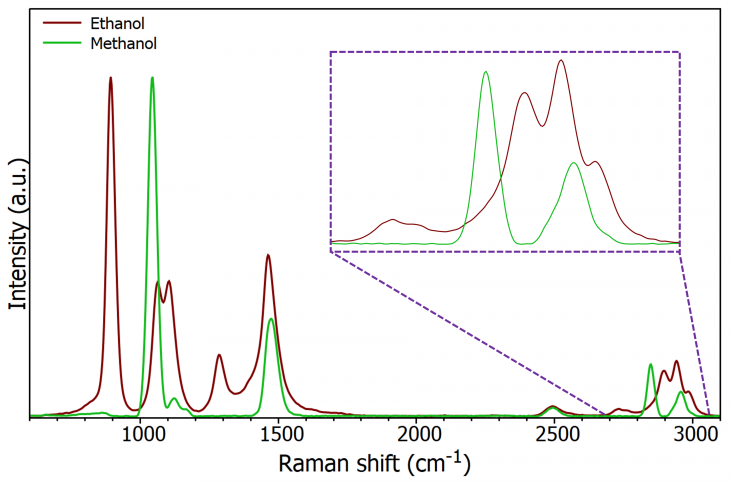
Figure 4. Raman spectrum of ethanol and methanol (insert is expanded high wave number region). Image Credit: Edinburgh Instruments
Spectra of whisky and a whisky sample spiked with 10% methanol were obtained after identifying the bands of interest, as shown in Figure 5. There are definite spectral differences between the two samples that can be attributed to the addition of methanol.
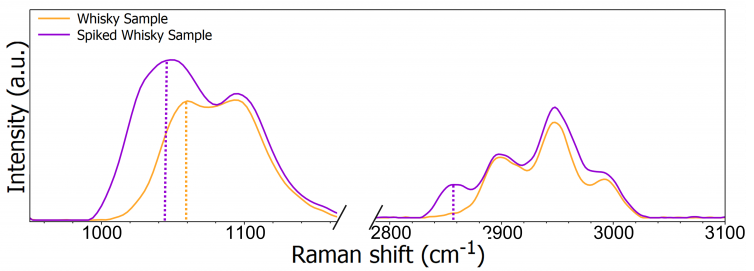
Figure 5. Normalized Raman spectra of an unspiked and spiked sample of whisky focussed on the two spectral regions of interest. Image Credit: Edinburgh Instruments
When a 300 gr/mm grating was used to acquire the spectra in Figure 5, the peaks between 1000 cm–1 and 1200 cm–1 merged into a single peak with two shoulders. The peak at approximately 1050 cm–1 was shifted to 1042 cm–1 when the whisky sample was spiked with methanol due to the influence of the methanol peak at 1035 cm–1.
However, due to the level of spectral resolution possible with a 300 gr/mm grating, the three expected peaks cannot be resolved, allowing the researchers to conclude that the sample contains methanol.
Using a grating with more millimeter-wide grooves per unit area — in this case, a 1200 gr/mm grating — can improve spectral resolution. Figure 6 demonstrates how, as the number of grooves is increased, the spectral resolution rises, enabling the observation of all three peaks and supplying concrete proof of methanol’s presence.
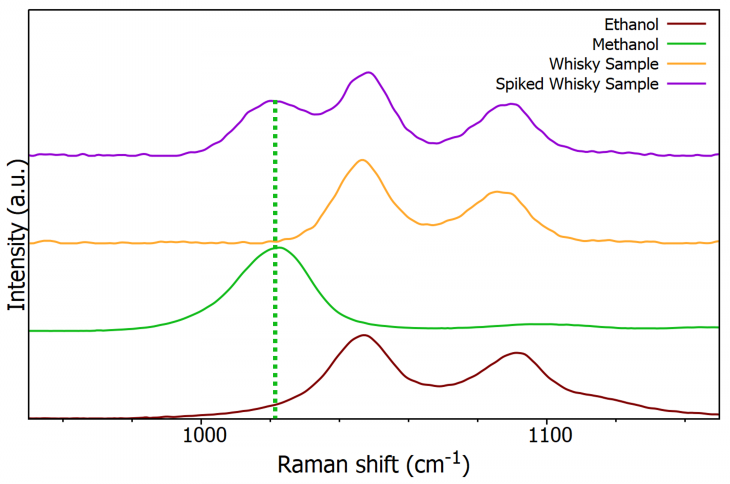
Figure 6. Offset normalized Raman spectra of ethanol (burgundy), methanol (green), whisky (orange), spiked whisky (purple) using a 1200 gr/mm grating. Image Credit: Edinburgh Instruments
Conclusion
Both the qualitative and the quantitative applications of Raman spectroscopy have been illustrated in this article. The quantitative evaluation of ethanol % for testing whisky authenticity can be done with ease using calibration curves created using band information from Raman spectra.
Qualitatively, the excellent chemical discrimination of Raman was used to identify the illicit presence of methanol in a whisky sample. All samples can be analyzed rapidly, making Raman spectroscopy an ideal technique for guaranteeing that whisky is being sold safely and legitimately.
References
- Facts & Figures, Scotch Whisky Association, https://www.scotch-whisky.org.uk/insights/facts-figures/, (Accessed 20 April 2022)
- Methanol Toxicological Overview, Public Health England, https://www.gov.uk/government/publications/methanol-properties-incident-management-and-toxicology , (Accessed 20 April 2022)
This information has been sourced, reviewed and adapted from materials provided by Edinburgh Instruments.
For more information on this source, please visit Edinburgh Instruments.