Tourmalines are well-known precious gemstones that are available in several colors. Chemically, tourmalines are members of the silicate minerals family, and their standard chemical formula1 is XY₃Z₆(T₆O₁₈)(BO₃)₃V₃W, where:
- X = Ca, Na, K, or a vacancy
- Y = Li, Mg, Fe²⁺, Mn²⁺, Al, Cr³⁺, V³⁺, Fe³⁺, (Ti⁴⁺)
- Z = Mg, Al, Fe³⁺, Cr³⁺, V³⁺
- T = Si, Al, (B)
- B = B (or a vacancy)
- V = OH, O
- W = OH, F, O
The presence of the species in parentheses has not been confirmed at these sites.
This diversity of possible combinations reveals the existence of 37 generally recognized tourmaline species, with schorl being the most prevalent, followed by elbaite and dravite.
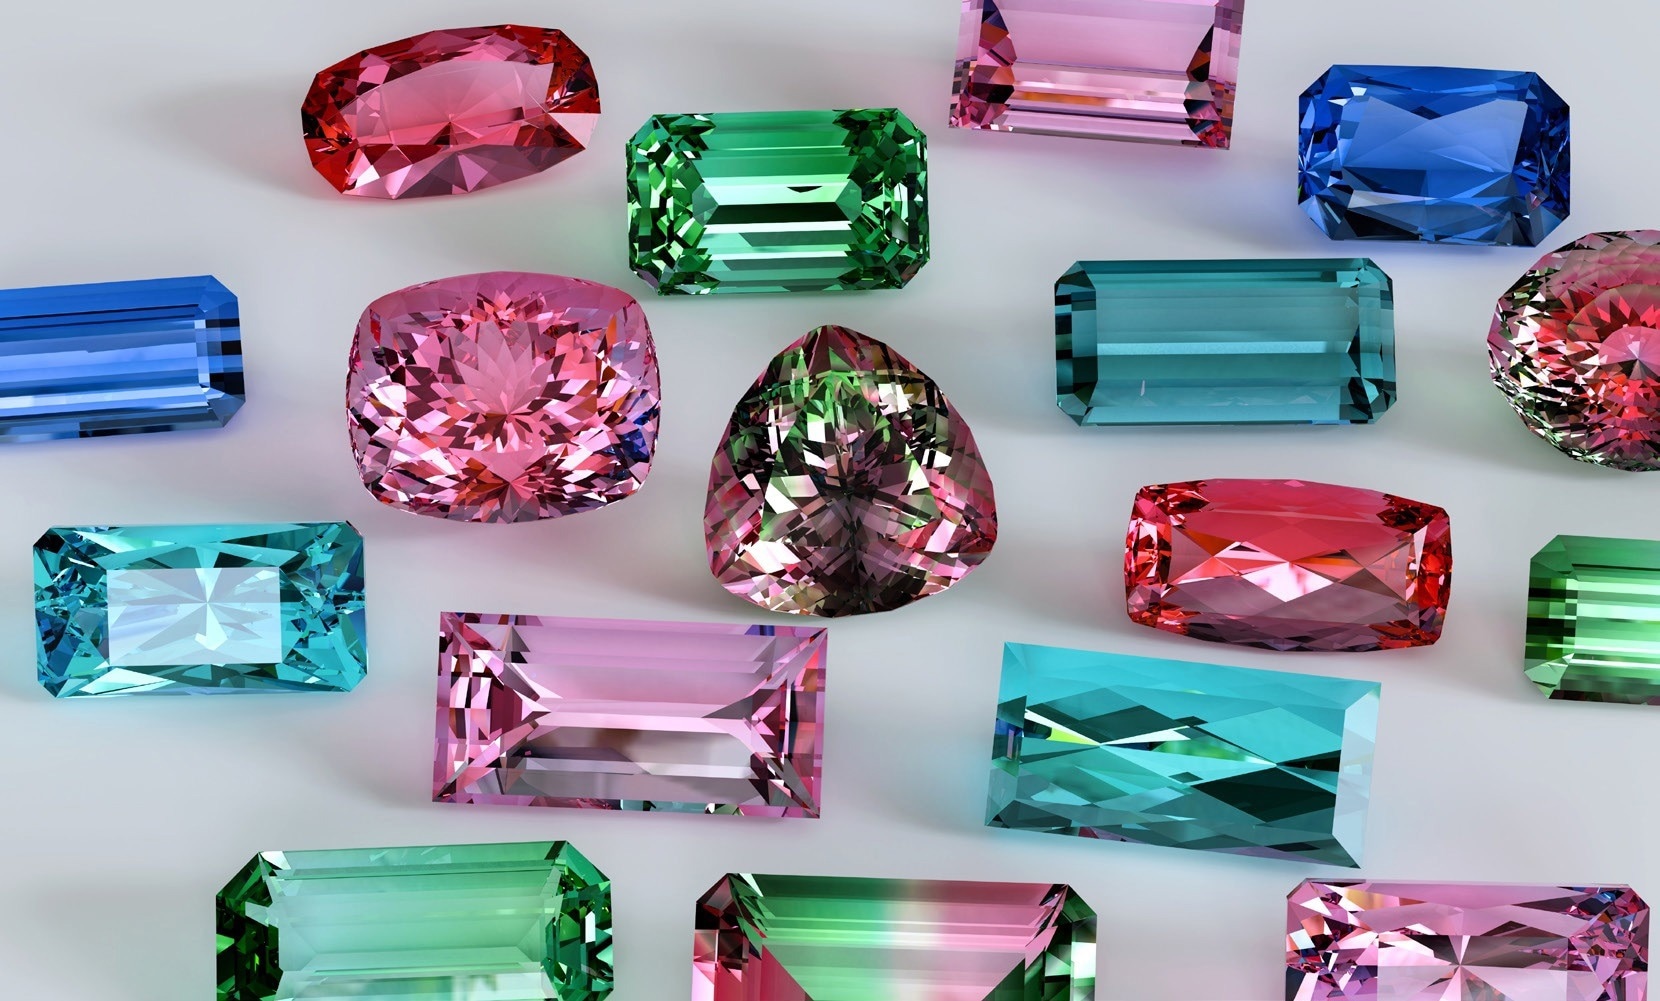
Image Credit: Thermo Fisher Scientific - Elemental Analyzers and Phase Analyzers
Each species can exist in several color variations (e.g. indicolite, rubellite, and verdelite are variants of elbaite.) Besides the primary elements, tourmalines can also include trace elements such as Mn, Zn, Ga, Ni, Cu, Sr, Ba, Sn, and Pb, which can be used to determine the stone’s geographical origin.
Energy-Dispersive X-Ray Fluorescence
Energy-dispersive X-Ray fluorescence (EDXRF) is a cost-effective substitute to laser-ablation coupled mass spectrometry (LA-ICP-MS) for quantifying major and trace elements in gemstones.
EDXRF is a non-destructive approach that permits rapid analysis with minimal operator training. In a related application note (AN41958), the applicability of EDXRF for the examination of gemstones was previously highlighted.
Table 1. EDXRF excitation conditions used for tourmaline analysis. Source: Thermo Fisher Scientific - Elemental Analyzers and Phase Analyzers
| Condition |
Filter |
Voltage, kV |
Atmosphere |
Live Time, s |
Elements |
| Low Za |
No Filter |
4 |
Vacuum |
60 |
Na, Mg, Al, Si |
| Low Zb |
C |
8 |
Vacuum |
120 |
K, Ca |
| Low Zc |
Al |
12 |
Vacuum |
120 |
Ti, V, Cr |
| Mid Za |
Pd Thin |
16 |
Vacuum |
120 |
Mn, Fe |
| Mid Zb |
Pd Medium |
20 |
Vacuum |
120 |
Ni, Cu, Zn, Ga |
| Mid Zc |
Pd Thick |
30 |
Vacuum |
120 |
Sr, Pb, Bi |
| High Za |
Cu thin |
50 |
Vacuum |
120 |
Nb |
| High Zb |
Cu Thick |
50 |
Vacuum |
120 |
Ag, Sn, Ba |
Gemstone Homogeneity
Acquiring representative and quantifiable compositional data is a typical challenge in gemstone research, primarily for tourmalines, whose composition varies across their volume.
To solve this using LA-ICP-MS, several analyzes would be needed, since the analysis spot size can only capture a limited volume of sample (i.e., micrometer scale). In comparison to LA-ICP-MS, the EDXRF analysis spot is much wider, encompassing millimeters instead of micrometers.
Consequently, a single EDXRF scan can yield a comprehensive, average composition. In this application note, the constancy of tourmaline EDXRF analysis is verified (by evaluating the same gemstone several times from a single orientation) and then comparing the average composition from several distinct orientations. This comparison can reveal both the durability and general uniformity of the gemstone.
Instrumentation
The Thermo Scientific™ ARL QUANT’X™ EDXRF Analyzer is a standalone instrument equipped with an air-cooled X-Ray tube with a power of 50 watts and a maximum voltage of 50 kV.
This experiment used a silver tube target, but a rhodium target could also be used. Nine main beam filters ensure that each element is optimally excited.
A silicon drift detector of the latest generation, coupled with a thin graphene window, enables the recognition of all periodic table constituents from carbon (Z = 6) onwards. Multiple collimators are provided for controlling the excitation point size down to 1 mm. A camera assists in placement for precisely pinpointing the excitation site.
Excitation Conditions
Table 1 displays the various excitation settings utilized to evaluate the tourmaline sample in conjunction with a 3.5 mm collimator. This collimator produces an elliptical excitation point of 5.8 mm by 4.5 mm. The total analysis time, including inactive time and the time needed to clean the sample chamber, is about 20 minutes.
Results and Discussion
The blue tourmaline employed for this investigation is a larger stone of ~60 g. It was examined at five distinct orientations (i.e., five distinct surfaces). To demonstrate the reproducibility of the equipment, the initial orientation (orientation A) was examined seven times without relocating the gemstone (Table 2).
Four other orientations (B, C, D, and E) of the tourmaline were then examined (Table 3). Finally, the standard variations acquired for various elements at one orientation were compared to those acquired by the average of all five orientations.
Since XRF cannot identify all tourmaline elements, 11%, 3%, and 4% w/w concentrations of B₂O₃, Li₂O, and H₂O were utilized. Calibration based on fundamental parameters (FP) to measure the composition of tourmaline was employed. Si was calculated as SiO₃ using the generic chemical formula, while other elements were detected in elemental form.
Contrasting Tables 2 and 3 demonstrated a significant increase in variance while averaging the several orientations of the tourmaline, notably for key elements such as Mn. A closer examination of the data indicated orientation E as the main contributor to this variance.
However, variance across orientations remains substantially greater, even when orientation E was eliminated. Except for trace elements with concentrations near the detection limit, the relative standard variation owing to orientation was ≤10%. Five to ten times less variance was observed when measurements were repeated at the same orientation.
The analytical variability of the instrument was substantially lower than the natural variance in the gemstone’s composition.
Table 2. EDXRF repeatability for blue tourmaline, measured from orientation A. Source: Thermo Fisher Scientific - Elemental Analyzers and Phase Analyzers
| |
Na
% |
Al
% |
SiO3
% |
K
% |
Ca
% |
Ti
% |
V
% |
Cr
% |
Mn
% |
Fe
% |
Ni
% |
Cu
% |
Ga
% |
Nb
% |
Sn
% |
Pb
% |
Bi
% |
Orientation
A Rep 1 |
2.22 |
22.76 |
52.57 |
0.143 |
0.371 |
0.0222 |
0.0005 |
0.0025 |
3.225 |
0.075 |
0.0009 |
0.485 |
0.0589 |
0.0006 |
0.0004 |
0.0070 |
0.0403 |
Orientation
A Rep 2 |
2.18 |
22.69 |
52.69 |
0.146 |
0.365 |
0.0212 |
0.0008 |
0.0021 |
3.230 |
0.069 |
0.0009 |
0.487 |
0.0589 |
0.0004 |
0.0012 |
0.0074 |
0.0409 |
Orientation
A Rep 3 |
2.23 |
22.74 |
52.61 |
0.144 |
0.362 |
0.0233 |
0.0005 |
0.0021 |
3.219 |
0.069 |
0.0009 |
0.490 |
0.0598 |
0.0004 |
0.0015 |
0.0080 |
0.0407 |
Orientation
A Rep 4 |
2.18 |
22.73 |
52.63 |
0.146 |
0.368 |
0.0225 |
0.0000 |
0.0024 |
3.232 |
0.070 |
0.0011 |
0.490 |
0.0593 |
0.0006 |
0.0011 |
0.0074 |
0.0407 |
Orientation
A Rep 5 |
2.19 |
22.72 |
52.66 |
0.146 |
0.364 |
0.0241 |
0.0002 |
0.0026 |
3.208 |
0.072 |
0.0009 |
0.484 |
0.0591 |
0.0007 |
0.0010 |
0.0079 |
0.0406 |
Orientation
A Rep 6 |
2.15 |
22.68 |
52.74 |
0.143 |
0.366 |
0.0226 |
0.0003 |
0.0027 |
3.214 |
0.071 |
0.0013 |
0.484 |
0.0586 |
0.0006 |
0.0000 |
0.0074 |
0.0403 |
Orientation
A Rep 7 |
2.14 |
22.64 |
52.83 |
0.141 |
0.365 |
0.0226 |
0.0001 |
0.0022 |
3.194 |
0.069 |
0.0010 |
0.486 |
0.0584 |
0.0005 |
0.0003 |
0.0071 |
0.0397 |
| Average |
2.19 |
22.71 |
52.68 |
0.144 |
0.366 |
0.0226 |
0.0003 |
0.0024 |
3.217 |
0.071 |
0.0010 |
0.487 |
0.0590 |
0.0005 |
0.0008 |
0.0075 |
0.0405 |
| 1-Sigma |
0.03 |
0.04 |
0.09 |
0.002 |
0.003 |
0.0009 |
0.0003 |
0.0002 |
0.013 |
0.002 |
0.0002 |
0.003 |
0.0005 |
0.0001 |
0.0006 |
0.0004 |
0.0004 |
| % RSD |
1.6 |
0.2 |
0.2 |
1.3 |
0.8 |
4.0 |
80.5 |
10.2 |
0.4 |
3.3 |
15.3 |
0.5 |
0.8 |
20.9 |
70.3 |
5.0 |
1.0 |
Table 3. Compositional variation of blue tourmaline measured from five different orientations. Source: Thermo Fisher Scientific - Elemental Analyzers and Phase Analyzers
| |
Na
% |
Al
% |
SiO3
% |
K
% |
Ca
% |
Ti
% |
V
% |
Cr
% |
Mn
% |
Fe
% |
Ni
% |
Cu
% |
Ga
% |
Nb
% |
Sn
% |
Pb
% |
Bi
% |
| Orientation A |
2.19 |
22.7 |
52.7 |
0.144 |
0.37 |
0.023 |
0.0003 |
0.0024 |
3.2 |
0.071 |
0.0010 |
0.49 |
0.059 |
0.0005 |
0.0008 |
0.0075 |
0.040 |
| Orientation B |
2.01 |
22.1 |
53.2 |
0.129 |
0.39 |
0.026 |
0.0000 |
0.0024 |
3.4 |
0.068 |
0.0009 |
0.55 |
0.067 |
0.0007 |
0.0009 |
0.0079 |
0.045 |
| Orientation C |
2.23 |
22.4 |
52.9 |
0.125 |
0.34 |
0.020 |
0.0013 |
0.0022 |
3.3 |
0.046 |
0.0009 |
0.50 |
0.058 |
0.0004 |
0.0004 |
0.0071 |
0.039 |
| Orientation D |
2.02 |
22.2 |
53.5 |
0.117 |
0.32 |
0.025 |
0.0000 |
0.0004 |
3.2 |
0.044 |
0.0007 |
0.48 |
0.056 |
0.0003 |
0.0009 |
0.0062 |
0.035 |
| Orientation E |
2.19 |
21.7 |
52.8 |
0.112 |
0.42 |
0.044 |
0.0012 |
0.0018 |
4.1 |
0.044 |
0.0000 |
0.46 |
0.046 |
0.0002 |
0.0014 |
0.0094 |
0.038 |
| Average |
2.13 |
22.2 |
53.0 |
0.125 |
0.37 |
0.028 |
0.0006 |
0.0018 |
3.5 |
0.055 |
0.0007 |
0.49 |
0.057 |
0.0004 |
0.0009 |
0.0076 |
0.040 |
| 1-Sigma |
0.10 |
0.4 |
0.3 |
0.012 |
0.04 |
0.009 |
0.0006 |
0.0008 |
0.4 |
0.013 |
0.0004 |
0.03 |
0.007 |
0.0002 |
0.0004 |
0.0012 |
0.004 |
| % RSD |
4.7 |
1.8 |
0.6 |
9.8 |
11.2 |
34.3 |
112.3 |
45.6 |
11.4 |
24.6 |
58.0 |
6.5 |
12.8 |
46.1 |
40.7 |
15.5 |
9.1 |
Conclusion
This article highlights the characteristics of the ARL QUANT’X EDXRF Spectrometer for the investigation of tourmalines, including the repeatability of various elements at different concentrations.
This data was compared to variance in gemstone composition resulting from heterogeneity. Compositional variation exhibited a 5- to 10-fold increase in standard deviation compared to instrument repeatability.
Though this difference is substantial, it also illustrates the technique's outstanding repeatability. With EDXRF, any compositional variations observed are due to its inherent inhomogeneity.
Reference
- Reference for definition and chemical formula: Hawthorne, F.C. & Henry, D.J. (1999). "Classification of the minerals of the tourmaline group" European Journal of Mineralogy, 11, pp. 201–216.

This information has been sourced, reviewed and adapted from materials provided by Thermo Fisher Scientific - Elemental Analyzers and Phase Analyzers.
For more information on this source, please visit Thermo Fisher Scientific - Elemental Analyzers and Phase Analyzers.