Sponsored by PerkinElmerMar 22 2023Reviewed by Olivia Frost
Ethanol is a critical blending component in fuels frequently used in petrol/gasoline. The ethanol concentration may vary from < 10% up to 85%, dependent on the final use of the fuel.
Due to its broad use, it is essential to check the concentrations of impurities in the ethanol, as these may adversely affect the performance of the resulting fuel. Consequently, standards have been produced for the sulfur (S), copper (Cu), and phosphorus (P) content in fuel.
A European Standard has been established to determine S, Cu, and P in ethanol directly; Table 1 lists these concentration ranges. ASTM D4806 is a specification for several components in anhydrous denatured ethanol planned to be blended with gasoline at 1-15% by volume, including Cu and S.
Table 1. IP 581 Concentration Ranges for Phosphorus, Sulfur, and Copper in Ethanol. Source: PerkinElmer
| Element |
Concentration (mg/kg) |
| P |
0.13 – 1.90 |
| S |
2.0 – 15.0 |
| Cu |
0.050 – 0.300 |
Ethanol analysis by ICP-OES may be complex due to high carbon content and volatility. The boiling point of ethanol (78 °C) is low, resulting in a sizable amount of ethanol in the gaseous form entering the plasma. This may cause the plasma to become unstable and eventually destroy the plasma.
The high carbon content may also settle on the injector or instrument interface during analysis, which may cause signal degradation over time. However, ethanol can be easily measured with a robust plasma and the correct selection of sample introduction components.
This work examines the analysis of S, Cu, P, and Fe in ethanol utilizing PerkinElmer’s Avio® 550 Max fully simultaneous ICP-OES.
Experimental
Samples and Sample Preparation
To prepare the ethanol samples and standards, 2% HNO3 (5 mL 2% HNO3 to 45 mL ethanol) was added to keep the analytes in the solution. Due to ethanol’s polar nature, aqueous stock standards could provide the calibration standards and spikes.
The calibration system implemented was the method of additions-calibrate. The calibration curve is prepared in a representative sample matrix in this calibration mode. All subsequent samples are evaluated in comparison with this calibration curve.
Calibration standards were made in ethanol and 2% HNO3 (v/v) at the concentrations in Table 2, from intermediate standards (1 mg/L Cu, Fe and 5 mg/L P, S). The ethanol sample was spiked at identical concentrations as the calibration standards to test for accuracy and then measured.
Table 2. Calibration Standards in Ethanol. Source: PerkinElmer
| Element |
Standard 1
(μg/L) |
Standard 2
(μg/L) |
Standard 3
(μg/L) |
| P, S |
100 |
250 |
500 |
| Cu, Fe |
20 |
50 |
100 |
A Ytterbium (Yb) was made to all standards and samples as an internal standard. Ar 420.069 nm was also monitored. The comparison of Ar (argon) and Yb signals were utilized to evaluate the stability of the plasma.
Instrumental Conditions
The analyses used an Avio 550 Max fully simultaneous ICP-OES (PerkinElmer, Shelton, Connecticut, USA) utilizing the parameters displayed in Table 3. All instrumental conditions were optimized to permit low-level determination of the components of interest.
Table 3. Instrumental Parameters for the Low-Level Analysis of Ethanol. Source: PerkinElmer
| Parameter |
Value |
| Sample Uptake Rate |
1 mL/min |
| Nebulizer |
MEINHARD® K1 |
| Spray Chamber |
PC3 Baffled Glass Cyclonic |
| Spray Chamber Temperature |
2 °C |
| Injector |
Alumina, 1.2 mm |
| Torch Position |
-5 |
| RF Power |
1500 W |
| View Mode |
Axial |
To reduce solvent loading to the plasma, the spray chamber was cooled to 2 °C, and a 1.2 mm injector was utilized. Increased sensitivity and stability were achieved by utilizing a torch position of -5 and observing the plasma in axial mode.
Most Avio 550 Max applications operate at a plasma flow of 8 L/min. However, depending on the sample introduction components utilized, this may differ with organic analyses.
Table 4. Elements and Wavelengths. Source: PerkinElmer
| Element |
Wavelength (nm) |
| P |
213.617, 214.914 |
| S |
180.669 |
| Cu |
327.393, 324.752, 224.700 |
| Fe |
238.204, 239.562, 259.939 |
| Yb |
328.937 |
The elements and wavelengths are presented in Table 4. Several wavelengths were observed for each component to verify the results. As a result of the fully simultaneous nature of the Avio 550 Max ICP-OES, the addition of further wavelengths does not increase the time taken for analysis.
Results and Discussion
To begin, analysis of the low-level calibration standard was conducted, and the peaks for each element were assessed. It was noted that a peak was present for nearly all wavelengths and could be integrated, confirming the capability to measure low levels.
The exception to this was S 180.669 nm, where a high background was noted. The upper spectra in Figure 1 display the calibration blank and standards; the black vertical line denotes the position of the S 180.669 nm peak.
This peak is on the shoulder of a background peak, which is highly likely to be a carbon band arising from ethanol. Consequently, low-level sulfur measurements are challenging.

Figure 1. Spectra of blank, 100, 250, and 500 μg/L sulfur standards in ethanol without MSF applied, and the resulting spectrum for the 100 μg/L standard after MSF is applied. Image Credit : PerkinElmer
However, the impact of the interference can be removed by using Multicomponent Spectral Fitting (MSF): a robust, simple-to-use algorithm, exclusive to Avio ICP-OES instruments, which utilizes all available information in the spectra and without relying on background or integration points.
The MSF model is developed from the spectra of a blank (2% HNO3), interference (ethanol), and a standard (500 µg/L S). Such spectra are defined, and the software automatically applies the MSF algorithm, generating an interference-free spectrum for sulfur, displayed in the lower spectrum in Figure 1.
The MSF model employed in the method is applied automatically to all samples and standards analyzed with the method, enabling interference-free low-level analysis.
Applying MSF to S, the calibration curves for all elements at all wavelengths produced correlation coefficients of 0.999 or greater. Subsequently, to establish the methodology accuracy, a second-source ethanol sample was analyzed, together with spike additions at the calibration standard concentrations.
Table 5. Results for Phosphorus and Sulfur in Ethanol. Source: PerkinElmer
| Sample |
P 213.617
(μg/L) |
P 214.914
(μg/L) |
S 180.669
(μg/L) |
| EtOH |
< 5 |
< 5 |
20 |
| EtOH + 100 μg/L |
99 |
98 |
121 |
| EtOH + 250 μg/L |
254 |
255 |
248 |
| EtOH + 500 μg/L |
483 |
496 |
500 |
Table 6. Results for Copper and Iron in Ethanol. Source: PerkinElmer
| Sample |
Cu 327.393
(μg/L) |
Cu 324.752
(μg/L) |
Cu 224.700
(μg/L) |
Fe 238.204
(μg/L) |
Fe 239.562
(μg/L) |
Fe 259.939
(μg/L) |
| EtOH |
< 2 |
< 2 |
< 2 |
< 1 |
< 1 |
< 1 |
| EtOH + 20 μg/L |
19.4 |
20.3 |
20.3 |
20.6 |
19.7 |
20.6 |
| EtOH + 50 μg/L |
50.1 |
52.6 |
49.9 |
52.6 |
49.6 |
52.1 |
| EtOH + 100 μg/L |
99.9 |
99.5 |
98.7 |
98.7 |
99.9 |
98.7 |
Table 5 presents the numerical results for S and P, while the results for Cu and Fe are shown in Table 6. Each element was present at less than the detection limit in the sample, except for sulfur, which was present at 20 µg/L.
The conformity between numerous wavelengths of each element verifies the numerical results. All spike recoveries are within 5% of their true values for all Cu, Fe, and P spike levels, and for all wavelengths. Only one S wavelength is accessible for analysis (180.669 nm) due to spectral overlaps, as shown in Figure 1.
As discussed previously, despite a carbon interference on S 180.669, MSF eliminates the interference, permitting S 180.669 nm to be assessed interference-free, with spike recoveries within 10% of their true values.
With the accuracy determined, a petrochemical ethanol sample was analyzed. Table 7 details these results, which correlate with the known values for this sample. The conformity between several wavelengths for all analytes (except S) further verifies the accuracy of the results.
Table 7. Concentrations in a Petrochemical Ethanol Sample. Source: PerkinElmer
| Element |
Wavelength (nm) |
Concentration |
| Cu |
327.393 |
< 2 |
| Cu |
324.752 |
< 2 |
| Cu |
224.700 |
< 2 |
| Fe |
238.204 |
21.0 |
| Fe |
239.562 |
19.4 |
| Fe |
259.939 |
20.6 |
| P |
213.617 |
< 5 |
| P |
214.914 |
< 5 |
| S |
180.669 |
263 |
The plasma stability was evaluated by observing the signal from both Ar and Yb. Since Ar is derived from the plasma, it is a real measure of the plasma stability, as it is not impacted by sample introduction (i.e. peristaltic pump, spray chamber, aerosol transport, nebulizer, etc.).
The signal of Yb is affected by sample introduction and the plasma, since it was added to all blanks, standards, and samples. Figure 2 displays the stability of both Ar and Yb over a 35-minute analytical run comprising of the samples, calibration standards, and QC checks.
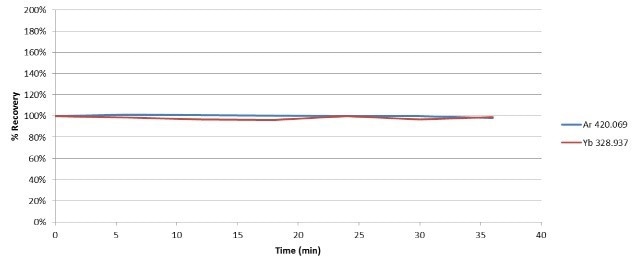
Figure 2. Stability of Ar and Yb during analysis of 100% ethanol. Image Credit : PerkinElmer
Ar differed by less than 2% over the duration of the run, displaying excellent plasma stability with the introduction of ethanol, a volatile organic solvent. The Yb signal recovered within 4% of the blank value, demonstrating that transport and sample introduction had very little effect on the stability.
Figure 2 also shows the relative standard deviation of the signals, further verifying the robustness of the instrumentation and methodology.
Conclusions
This work exhibits the capability of the Avio 550 Max fully simultaneous ICP-OES to measure low levels of S, Cu, P, and Fe in ethanol, in agreement with European Standard IP 581.
By choosing the appropriate plasma conditions and sample introduction, low concentrations of S, Cu, P, and Fe can be accurately measured directly in ethanol, without the requirement for dilution.
A spectral interference on S 180.669 is eradicated by the use of Multicomponent Spectral Fitting, enabling accurate results to be achieved at concentrations as low as 100 µg/L.
Consumables Used
Table 8. Source: PerkinElmer
| Component |
Part Number |
| Sample Uptake Tubing, Black/Black (0.76 mm id), PVC |
N0777043 (Flared)
09908587 (Non-flared) |
| Drain Tubing, Red/Red (1.14 mm id), PVC |
09908585 |
| Internal Standard Tubing, Orange/Green (0.38 mm id), PVC |
N0773111 (Flared) |
| Copper Standard, 1000 mg/L |
N9300183 (125 mL)
N9300114 (500 mL) |
| Iron Standard, 1000 mg/L |
N9303771 (125 mL)
N9300126 (500 mL) |
| Phosphorus Standard, 1000 mg/L |
N9303788 (125 mL)
N9300139 (500 mL) |
| Sulfur Standard, 1000 mg/L |
N9303796 (125 mL)
N9300154 (500 mL) |
| Ytterbium Standard, 1000 mg/L |
N9303811 (125 mL)
N9300166 (500 mL) |
| Autosampler Tubes |
B0193233 (15 mL)
B0193234 (50 mL) |
References and Further Reading
- “Multicomponent Spectral Fitting”, Technical Note, PerkinElmer Inc., 2017.

This information has been sourced, reviewed and adapted from materials provided by PerkinElmer.
For more information on this source, please visit PerkinElmer.