Sponsored by PerkinElmerMar 22 2023Reviewed by Olivia Frost
The US Environmental Protection Agency (EPA) has employed a series of initiatives since the early 2000s to endorse the introduction and utilization of renewable fuels, with the target of 136 billion liters of renewable fuel being mixed with gasoline by 2022.1
To date, ethanol is the primary renewable fuel utilized for transportation in the US.2,3 Since the early 2000s, the manufacture of vehicles operating on high-ethanol-content gasoline blends (flex fuels) has increased.
These fuels have gathered interest due to their reduction in greenhouse gas emissions (at least 40% compared to gasoline) and reduced vapor loss/volatility during transport and storage compared to conventional high-petroleum gasoline blends.4,5
Before their use, flex fuels must be analyzed to establish the quantity of methanol and ethanol they contain, to support the evaluation of product quality to determine their final use.
ASTM Method D5501, most recently updated in 2020, offers guidelines for flex fuel analysis utilizing a 150-m Detailed Hydrocarbon Analysis (DHA) analytical column.6
Flex fuels are permitted to contain between 51% and 83% w/w ethanol, while methanol content must not exceed 0.6% w/w. The broad range of target analyte concentrations demands a robust calibration process. The long analytical column permits improved resolution of methanol from co-eluting C4 hydrocarbon isomers.
This article looks at the performance of the PerkinElmer GC 2400™ System for analysis of E85, corresponding to ASTM Method D5501. The GC 2400 System delivers quantitative repeatability and ideal separation efficiency for ASTM Method D5501- 20 analysis.
PerkinElmer SimplicityChrom™ Chromatography Data System (CDS) Software and the detachable touchscreen interface enable insightful, high-throughput laboratory workflows and real-time examination of data in any location the operator is connected to the VPN.
The PerkinElmer Elite DHA-150 column gives an inert separation setting and exceptional peak shape for polar hydrocarbon analysis.
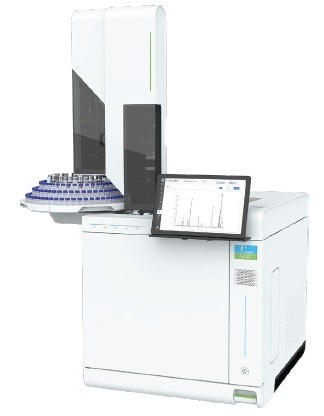
PerkinElmer GC 2400 System. Image Credit : PerkinElmer
Experimental
Table 1. GC Parameters. Source: PerkinElmer
| GC Parameters |
| Instrument |
PerkinElmer GC 2400 System |
-- |
| Injector |
Capillary Split/Splitless (CAP) with Autosampler |
-- |
| |
Advanced Green Inlet Septum |
N9306218 |
| |
Green FocusLiner |
N6502041 |
| |
5 uL Autosampler Syringe |
N6402186 |
| Detector |
Flame Ionization Detector (FID) |
-- |
| |
Grade 5 Hydrogen, 35 mL/min |
-- |
| |
Grade 5 Air, 400 mL/min |
-- |
| |
Grade 5 Nitrogen, 25 mL/min |
-- |
| Gas Filters |
Triple Filter (Hydrogen & Nitrogen) |
N9306110 |
| |
Moisture/Hydrocarbon Trap (Air) |
N9306117 |
| Analytical Column |
PerkinElmer 150 m x 0.25 mm x 1.0 μm |
N6107239 |
| |
Graphite/Vespel Ferrules, 0.4 mm I.D. |
09920104 |
| Software |
SimplicityChrom CDS Software |
-- |
Table 2. Measurement conditions. Source: PerkinElmer
| Conditions |
| Carrier |
Grade 5 Hydrogen, linear velocity control at 21 cm/sec |
| Septum Purge |
3 mL/min |
| Split |
300 mL/min |
| Injection Volume |
0.5 μL |
| Injector Temp. |
250 °C |
| Detector Temp |
300 °C |
| Oven |
60 °C for 15 min, 30 °C/min to 250 °C, hold for 23 min |
Calibration standards ranging from 0.5%-10% w/w heptane, 20%-99% w/w ethanol, and 0.1% - 0.6% w/w methanol were acquired from Spectrum Quality Standards (Houston, TX), with heptane as the representative hydrocarbon standard.
Isooctane diluent was acquired from VWR (Radnor, PA), and E85 gasoline was obtained from a local gas station in Stamford, CT.
After triplicate blanks, calibration standards were analyzed, and the measurements were obtained for repeatability. Linear regression was conducted for all three analytes.
The calibration curve was deemed linear if the correlation coefficient, R2, fulfilled the criterion R2 ≥ 0.995 over the analyzed range. Following calibration, a fourth blank was utilized before the E85 sample. The E85 sample was run as a neat solution, and the measurement was taken five times.
Method detection limit (MDL) analysis was carried out in agreement with USEPA guidelines.3 An ethanol standard was created at an approximate concentration of ten times the anticipated MDL via dilution of the lowest concentration calibration standard in isooctane.
This prepared ethanol standard was analyzed a total of seven times. The MDL was determined utilizing the following formula:
MDLethanol = SDethanol * Student’s t
SD denotes the standard deviation of the seven ethanol standard trials, and 3.14 is the value of Student’s t, corresponding to the one-handed t-test value at 99% confidence and six degrees of freedom.
The calibration method succeeded, with R2 meeting the condition for each analyte regression, as shown in Figure 1. A standard calibration chromatogram is shown in Figure 2A.
The barely visible methanol peak highlights the considerable difference in calibrated concentrations between ethanol and methanol. The E85 flex fuel sample chromatogram is shown in Figure 2B.
ASTM Method D5501-20 cautions that small, polar organic compounds (e.g., ethanol and methanol) are susceptible to substantial peak tailing. Figure 2C exhibits no detectable peak tailing for such compounds in this case.
The Elite DHA-150 column offers an inert flow path, generating exceptional gaussian peak shapes for small polar organic compounds that do not appear significantly different from neighboring nonpolar gasoline hydrocarbons.
Results and Discussion
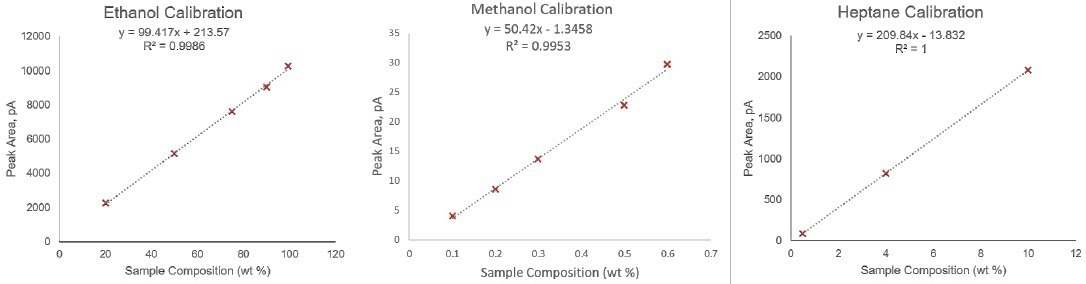
Figure 1. Calibration set results for ethanol, methanol, and heptane. Note: In 3 of the 5 standards, heptane was kept at a 10% concentration; results are presented for this average. Image Credit : PerkinElmer
The system demonstrated excellent analytical precision. Ethanol was detected in the flex fuel with a 1.15% relative standard deviation (RSD), indicating very high repeatability, as shown in Table 1.
For methanol, the RSD was marginally greater but remained within a satisfactory range due to its low concentration within the sample.
This data demonstrates the robustness of the GC 2400 System for the analysis of fuel alcohol over a broad range of sample concentrations. This makes it a perfect solution for ASTM D5501-20 analysis.
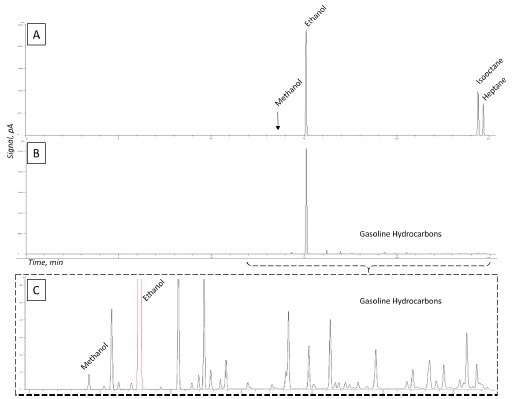
Figure 2. Chromatograms of an analytical standard (A), sample chromatogram (B), and close-up of low-level sample components (C). Image Credit : PerkinElmer
While it is beyond the scope of ASTM Method D5501-20, a method detection limit (MDL) study was performed to demonstrate the broad analytical dynamic range of the GC 2400 System with FID Detector.
Analysis was conducted of a standard measured at ~0.03% concentration in seven replicates, and the results are presented in Table 2. An MDL of 0.0025% and the lower confidence limit (LCL) and upper confidence limit (UCL) concentrations are displayed in Table 3.
Table 3. Repeatability test results from n=5 sample analyses. Source: PerkinElmer
| Component |
Commercial E85 Sample Alcohol Composition (wt %) |
| Run 1 |
Run 2 |
Run 3 |
Run 4 |
Run 5 |
Average |
RSD |
| Ethanol |
80.2 |
78.4 |
80.1 |
78.5 |
80.0 |
79.4 |
1.15% |
| Methanol |
0.56 |
0.55 |
0.54 |
0.51 |
0.53 |
0.54 |
3.63% |
It is extraordinary that such low detection limits are attainable (spanning over five orders of magnitude difference), considering that this method can quantify 99 wt% ethanol.
Table 4. MDL concentration results showing high precision at the lowest end of the linear range. Source: PerkinElmer
| Ethanol MDL Composition (wt %) |
| Run 1 |
Run 2 |
Run 3 |
Run 4 |
Run 5 |
Run 6 |
Run 7 |
Average |
SD |
RSD |
| 0.030 |
0.031 |
0.031 |
0.030 |
0.031 |
0.031 |
0.029 |
0.031 |
7.84 E04 |
2.57% |
Table 5. Method detection limit and upper and lower confidence limits. Source: PerkinElmer
| Ethanol Detection Limits (wt %) |
| MDL |
LCL |
UCL |
| 0.0025 |
0.0016 |
0.0054 |
Conclusion
Flex Fuel (E85) analysis, according to ASTM D5501, is crucial to establish ethanol and methanol content in fuels for evaluating the quality of the product.
The results achieved by the GC 2400 System either met or surpassed the ASTM D5501 requirements. The GC 2400 System demonstrated excellent analytical precision while allowing robust fuel alcohol analysis over a broad range of sample concentrations.
References and Further Reading
- R. Suarez-Bertoa, A.A. Zardini, H. Keuken, C. Astorga, (2015) Impact of ethanol containing gasoline blends on emissions from a flex‑fuel vehicle tested over the Worldwide Harmonized Light duty Test Cycle (WLTC). Fuel, 143, pp. 173-182, ISSN 0016-2361, https://www.sciencedirect.com/science/article/pii/S0016236114010710
- M. Balat, H. Balat, C. Öz, (2008) Progress in bioethanol processing. Prog Energy Combust Sci, 34, pp. 551-573.
- T.D. Durbin, J.W. Miller, T. Younglove, T. Huai, K. Cocker (2007) Effects of fuel ethanol content and volatility on regulated and unregulated exhaust emissions for the latest technology gasoline vehicles. Environ Sci Technol, 41, pp. 4059-4064/
- https://afdc.energy.gov/vehicles/flexible_fuel_emissions.html
- American Society for Testing and Materials. Method ASTM D5501-20. 2020.
- U.S. EPA. 51 FR 23703, Definition and Procedure for the Determination of the Method Detection Limit, Government Printing Office, Washington, D.C., 1986.

This information has been sourced, reviewed and adapted from materials provided by PerkinElmer.
For more information on this source, please visit PerkinElmer.